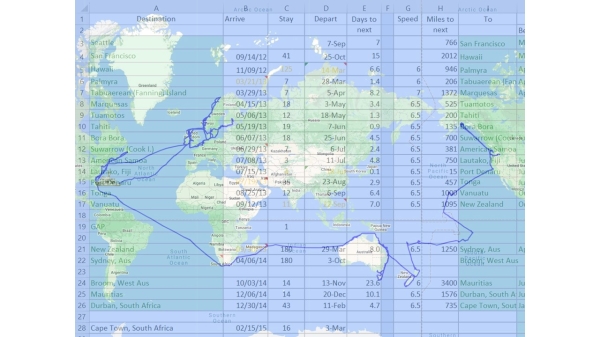
Planning a trip around the world in a small boat is a major undertaking. One of the many issues to contend with is timing, including insurance restrictions for certain locations, optimal weather to travel, availability of fuel, visa limitations, travel distances and speed, and fixed arrival or departure dates. To help us plan our journey, we built a spreadsheet that incorporated this information and allowed us to see at a glance our overall plan, where we would be when, and for how long.
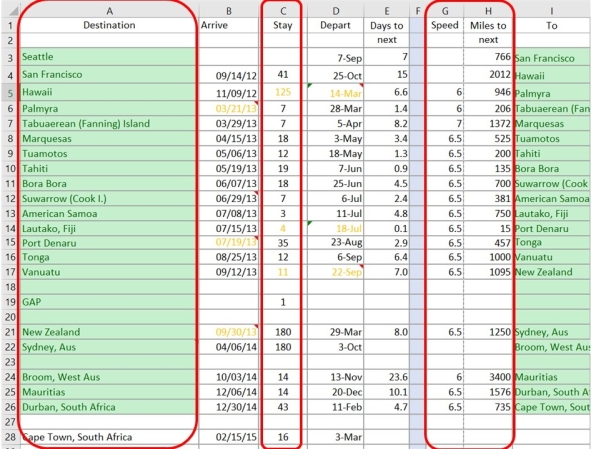
A simplified version of the spreadsheet is shown below (click image for a larger view). The main inputs to the spreadsheet are destination (column A), stay duration in days (column C), and the running speed and distance to the next destination (columns G and H). For planning purposes, we generally used a speed of 6.5 knots for shorter passages and 6 knots for longer runs where we were more fuel-constrained. The rest of the columns are calculated using these values, with arrival and departure dates determined based on the initial departure date in row 3. We often traveled faster, as allowed by fuel on hand.
We flexibly allocated our time to areas we found most interesting or enjoyable in between fixed points such as marina reservations or visa limits. These fixed dates are highlighted in yellow, where the arrival or departure date is explicitly typed into the spreadsheet and the number of days in the previous location, also highlighted in yellow, is automatically calculated instead of being entered manually. For example, we had a fixed arrival time into New Zealand of Sept 20th, 2013 for a quarantine booking for our cat Spitfire.
We also found it useful to calculate the gap between some of these fixed dates and our current itinerary to ensure the overall schedule didn’t put us too far ahead or behind schedule. For example, row 19 shows the number of extra days between the current scheduled departure from Vanuatu and our required departure in order to arrive into New Zealand on Sept 30th.
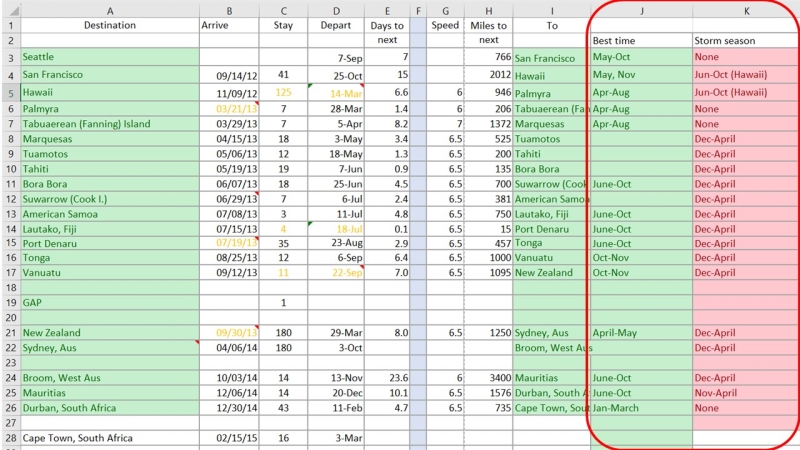
We also added to the right of this schedule the best time to travel that route (column J below) and the storm season (column K), taken from Jimmy Cornell’s World Cruising Routes. This allowed us to easily ensure that planned dates fell outside of that destination’s storm season. (In the full spreadsheet, we also included insurance restrictions, although these tended to line up pretty closely with the storm seasons.)
The spreadsheet gave us a rough idea of an itinerary, and we evolved it as we got closer to a particular destination. For example, in the initial version shown above we are simply in New Zealand and Australia for 180 days each and reach South Africa in December of 2014. We ended up spending 9 months in New Zealand and 15 in Australia and didn’t arrive into South Africa for nearly a year after initially planned, in the fall of 2015.
The full version of the spreadsheet is at https://mvdirona.com/blog/content/binary/Hamilton_ATW_Itinerary.xlsx. The spreadsheet contains two worksheets, one showing our initial plan to reach Cape Town and the second with more detail on our time in New Zealand and Australia and a plan to reach Barbados. We tended to create a new worksheet for each major plan iteration.


Once again, post selling your boat, you guys continue to help and give your wisdom and experience in travelling the world on a Nordhavn. Thank you.
I used a similar concept whilst doing the great loop, but the complications were a little easier.
I will be happy to study this example from of your trip from USA to NZ, as we have this on the list to do In the future.
Good hearing from you Duane and thanks for the feedback on the blog. We hope your US to New Zealand boat trip goes well. If you can take your time on your trip, taking few months across the South Pacific will be memorable. We also plan to do the great loop ourselves sometime in the future.
Note that the spreadsheet link is broken. Greetings. Raffaele
Thanks for pointing out the broken link Raffaele. We’ve fixed it.
Jennifer