You never know your boat’s real range until you start to make substantial ocean passages. Theoretical range in flat water with no current and little wind can be surprisingly optimistic so we probe the bounds conservatively. The 3,023 nm Indian Ocean crossing from Dampier, Australia to Rodrigues, Mauritius is the furthest we have ever gone between fuel stops but, still, it’s only a small and fairly safe extension over our previous longest run where we did 2,600 nm between Hawaii and the Marquesas Islands. On that 2,600 nm run we stopped and visited both Palmyra Atoll and Fanning Island en route, so the actual open ocean crossing distance wasn’t longer than previous trips. Prior to our Indian Ocean crossing, the longest unbroken offshore run we have completed was 2,000 nm from San Francisco to Hawaii. So the latest 19-day, 3,023 nm open ocean run is, by far, our furthest between both fuel stops and landfalls.
Every crossing brings new data and more experience. On this last run the most interesting learning was that our range is much further than we previously understood. Or, for a given distance, we will be able to travel it faster. We use the engine control unit (ECU) reported fuel burn numbers to control our speed and help ensure we arrive with the intended safety margin. We’ve been told these numbers are very accurate and we have tested them and verified numerous times that they are indeed incredibly precise.
We have hand-calibrated sight gauges where we have filled the tanks up from the bottom to the top in 25-gallon increments, marking the sight gauges on each increment, so they are now quite accurate. In addition, we have installed a Maretron FPM100 Fluid Pressure Monitor that we use to measure hydraulic system pressure, transmission system pressure and also tank levels. To measure hydraulic pressure we use a Setra 0-5000 PSI pressure sensor. To measure tank levels we use, depending upon the fuel depth in that particular tank, either a Setra 0-2 PSI or a Setra 0-3 PSI pressure sensor. These also required calibration where the tank is filled, this time in 1/16 of a full tank increments. But, once calibrated, the FPM100 provides approximately +/-3% accuracy. On large tanks, that’s an impressive degree of precision.

With a combination of the sight gauges and the Maretron FPM100 electronic gauges, we have a fair degree of confidence in the quantity of fuel being carried. This tank level data is far more precise than we have had in past crossings. What we have learned over the last year using these fairly precise tank level indicators is that the Deere ECU-reported fuel economy is very accurate. Prior to this trip, we have been able to detect no variance between the sight gauges, the electronic tank level sensors, and the ECU-reported fuel burn. But, on the Indian Ocean trip, the ECU-reported burn was 13% higher than the actual burn. The cause of the surprising discrepancy is that in coastal cruising, where we are operating at higher engine loads, the ECU-reported fuel burn is very precise. But, when operating at nearer to 25% load, rather than the 75% load and above we usually run when coastal cruising, the ECU is just over 13% conservative which is to say our actual range is 13% further than we thought.
It took nearly half the trip to conclude this was occurring and be confident that we were not seeing measurement error in tank levels. Each fuel level check ended up with a bigger number than expected. Early in the trip, it was only 10 to 20 gallons, so this was lost in the measurement noise. But, as the trip progressed, the number just kept going up. Eventually we had 160 gallons “too much”. At that point, the data was inarguable and we adjusted our speed to run much faster and enjoy the couple of hundred gallons of newly “discovered” fuel. This is one of the reasons why the second half of the run was so much faster than the first half.
.jpg)
This is great news because it means our maximum range is actually well in excess of 3,500 nm and, even better, we can run faster than we have been running on longer runs. It’s like we just added more than 300 gallons of fuel tank capacity to Dirona.
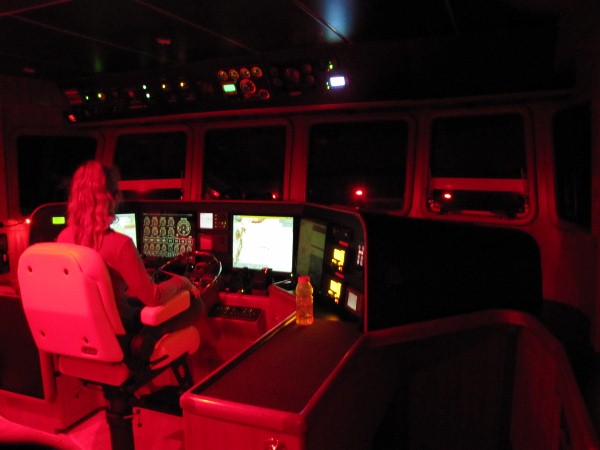
Another learning from a 19-day stint at sea is that, if the weather isn’t rough, it’s really not at all hard. It’s a bit more work and it takes a bit more motivation to get jobs done but, generally, it’s not a big thing. After 19 days at sea, we arrived feeling refreshed. It was not a strenuous or difficult passage even though there were only 2 people on the boat and we man the helm in shifts. Years ago we ran 4 hours on 4 hours off but we just kept evolving our shifts and ended up with Jennifer going to sleep at 6pm for 4 hours and getting up at 10pm, taking the helm from 10 to 5am, then sleeping from 5am to 10am or whenever she wakes up naturally. I take the helm for most of the day. It seems to work for us and, in good weather, it’s not much more tiring than a normal work day.
.jpg)
We have gotten comfortable with our shift schedule and don’t find it particularly tiring in good conditions. In rough weather, it’s tiring no matter what you do. It’s hard to sleep as soundly in rough water and it’s just more work to move around. So far, we haven’t found a solution to that other than bad weather avoidance by aiming for the statistical best weather time of year.
We have always operated Dirona by driving to the required fuel economy rather than the more common practice of setting a specific RPM for the trip. The reason we prefer to drive to fuel economy is that this really is the limiting factor on longer trips. We have found that current, winds, and swell can have a tremendous impact on fuel economy. When we first got Dirona, like many new owners, we carefully measured our fuel economy on flat water and were amazed at how good it was. Then we went out in the open ocean and were amazed at how much different the results were. Swell can take 3/4 of a knot off the top and, there are times we it can be as much as a full knot can be lost. This is huge because the fuel burn stays the same, the RPM stays the same, but the distance traveled can be reduced by upwards of 15%. The effective “loss” of 15% of the distance could yield some unfortunate surprises when crossing an ocean.
Arguably the negative impact of swell isn’t that surprising but what has been an eye opener for us is the power and speed of open ocean currents. It seems strange that the 1,000 nm from shore it’s possible to find current running a full knot or more, but it certainly does happen. What is perhaps even more surprising is how much it can change over very short distances. The overall ocean current predictions probably are reasonably accurate on average but the hour to hour changes in currents are not predicted and there have been trips where we have seen currents for days at a time that were running opposite to the predictions. I’ve jokingly concluded that ocean current predictions are only there to make weather prediction look comparatively accurate.
Because actual fuel economy can vary so greatly due to the force of winds, currents, and swell, you really only have two choices. You can allocate a very large reserve to account for the fact that the actual consumption can vary by 15 to 20% in adverse conditions or you will need to just periodically check point on the fuel load and distance left, and adjust speed to fit. The latter allows the boat to run faster and it seems the safer approach as well, so we run to the trip-required fuel economy.
Now that we have accurate fuel tank level data, I have written software that tracks distance left and fuel left on the trip and keeps an up-to-date fuel economy goal. The program uses this data to compute the needed fuel economy and the current rate of consumption and shows two green lights when operating at the correct speed. If conditions change and we end up getting better economy than predicted, one light is switched from green to orange to indicate that more speed will still allow the destination to be reached with the intended reserves. If conditions worsen and the fuel economy falls below the goal, then the left light changes from green to red to indicate that the boat needs to be slowed to improve the fuel economy. We essentially just “drive the lights” and verify the computations and electronic fuel level indications using the sight gauges on each engine room check.
.jpg)
|
.jpg)
|
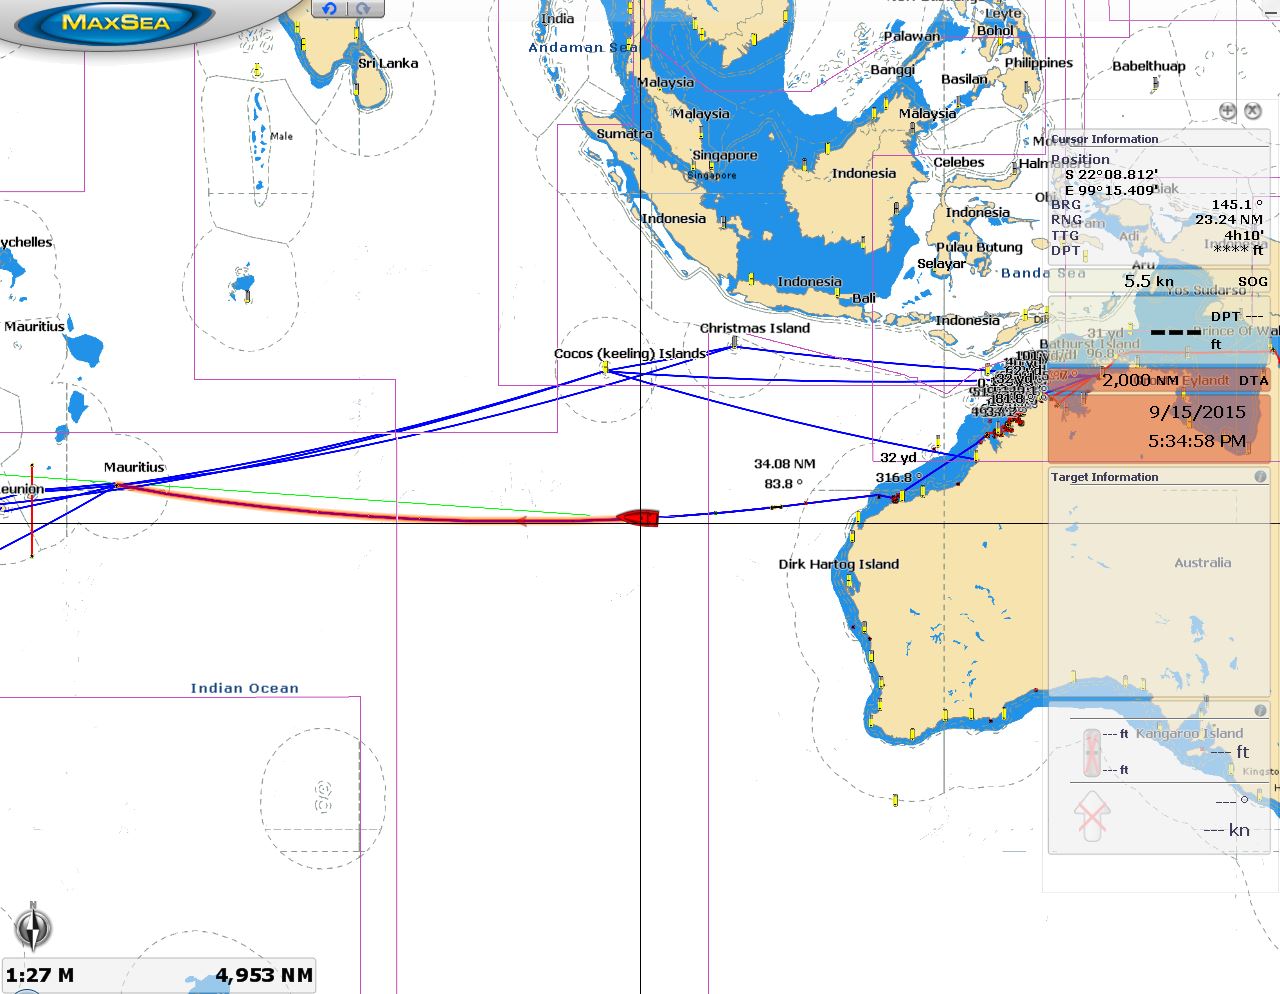
Nothing is more relaxing when aiming to finish a run with 200 gallons remaining and arriving with exactly the expected fuel left. It’s nice to see the systems operating as expected. The summary data from this trip are:
- Fuel consumed: 2365.6 gallons
- Fuel left on arrival: 221 gallons
- Total actual distance: 3023.2
- Overall fuel economy: 1.28nm/g
- Overall speed: 6.6 kts
- Total trip hours: 461.3 (19 days, 5.3 hours)
- Gallons per hour: 5.13
- Average RPM: 1681
and 1 gallon = ? liters?
I am not familiar wth the regular usage, i.e imperial, dry, normal?
Thanks.
Hi James
Great to see you are well underway and trucking along in such nice weather.
I am in awe of your courage and determination in tackling what is a serious navigation effort in time distance and geography.
Your data inset is fascinating and coming from an aviation background and naturally OCD on fuel I cant resist running the ruler over the fuel plan, as I have spent a long working life racing the fuel gauge to the next refuel. Nowadays, over most distances 80% of the cockpit workload is fuel monitoring/management as we only carry as much fuel as we plan to need, it costs about 2-5% of the fuel weight to tanker unnecessary fuel.
Because we work in three dimensions, which include massive differences in fuel burn between lower and higher altitudes, likewise winds aloft and aircraft weight, there are two guaranteed worry wort issues.
Pre take-off fuel load required (not too much not to little), what is forecast to happen, and, inflight fuel management, or working the plan and what is actually happening.
On longer flights, at take off you usually do not have enough fuel to make the destination and rely on the aircraft getting lighter as it burns off fuel, this translates to higher speeds usually traded off to lower thrust/fuel flow and also means you can achieve higher altitudes and the consequent lower fuel flows. You may have heard of the term “making fuel” which means working up to a higher altitude to decrease the fuel flow. Getting higher is limited by aircraft weight so it is a continuous trade off as weight decreases. This is usually accompanied by a reduction in airspeed as the thrust becomes limited as you get towards your ceiling. It’s always a fascinating and demanding calculus.
So everything is a moveable feast in turns of the fuel howgozit chart.
Fortunately nowadays the FMS system (Flight Management System usually three independent systems monitoring each other), computer connected to everything, takes the computing drudge out of it, but like you, I still keep a running fix in my head using some simple heuristics developed over the years. And of course there is always “index error” ☺ or finger trouble actually.
We use the simple concept of specific ground range, sgr, defined by the amount of fuel (in lbs/litres or gals whatever) being used to cover a nm, which makes possible the integration of all of the above variables into a single number, which can then be compared to the dist. to run and fuel available and directs action required to remedy a shortfall if possible. Climb to make fuel, reduce thrust, diversion options etc etc,
I note your data output appears to include this calculation expressed as “Fuel Economy” noted in a recent data set at 1.03 nm/gal. I assume this number from your computer monitoring is based on GPS derived distance run against actual fuel consumed.
I note from your Dampier – Mauritius run you achieved an sgr of 1.28nm/gal, or a nearly 20% reduction, what has changed?
I see since I commenced writing this post your sgr at Position: -14° 13.95′, -9° 19.48′ (-9.3247, -14.2326)has increased to 1.34, which is much better
My math suggests that, with zero contingency, for the balance of the journey the fuel required for the distance remaining 3555nm a total of 3418/1.34 = 2550gals (fuel available = 2598gals) which is coming into focus.
I have no experience in long range marine navigation but a perusal of the route once you get abeam the Brazilian coast a contingency might be based on the several ports en route rather than a percentage of total fuel say 400 nm as an enroute diversion suggesting a decision point fro diversion or not from the present position at the current sgr of say fuel remaining 2517 gals less (400/1.34) say 300 gals = 2217gals or 2215 nm from the present position.
Forgive me if I have this ass backwards and I am sure this is not news but I would be interested in your comments on how this might occur.
I am assuming that your management computer gets its data from the FMU on the engine, as does the aircraft FMS and integrates it with the nav data.
You mentioned in a previous post that the fuel content gauges might be in error for the moment, a problem we deal with by recording what actually went into the tanks, which you have done, rather than what the gauges might say.
In the meantime there is plenty of time and options once you get abeam Natal. In commercial terms we always aim and work to achieve the planned destination but it requires a bit of hard work, well reasoned decisions and not a little pressure.
Have fun and I look forward to your next report. ☺
You nailed most of the factors Gary. The closer you get to the details. the more messy the fuel calculations become. Predicting the fuel economy of a vehicle floating in a moving fluid where the depth of imersion is changing, the fluid movement is changing, and the parts of the vehicle not floating are in a lower density but still very powerful fluid also moving. Further complicating things, fully 15% of the weight of Dirona is currently fuel and, as times goes on and that fuel burns off, economy will improve slightly. Messy. It’s made more complex by the fact that having a precise measure of fuel on board. We have three sources of on board fuel levels: 1) sight sensors, 2) pressure gauges, 3) ECU fuel burn readings. This should be and eventually will be a blog entry but, as a first cut, I offer it as an excessively long comment.
The sight gauges rely on gravity and, as a consequence, require some skill to read in a moving sea way. Like all gauges, if the sight gauges are not calibrated by filling the tank slowly in small increments and marking off the level, they are not very accurate at all. But with careful calibration they are pretty good. My estimate is they are +/-5 to 7% of the fuel load. The challenge is 7% of the fuel load is 189 gallons which is a very large margin of error. Perhaps with care you could get the error down to 5% but that is still 135 gallons. Another problem with sight gauges at least on Dirona is they don’t read the lower 50 gallons and they don’t read the top 185 gallons of each side tank. Since that problem aplies to both tanks, the sight gauges don’t read 470 gallons or about 17% of the fuel load. The sight guages not reading the top 185 gallons is a real problem when carrying deck fuel. For safety reasons, you don’t want to be operating with low main tanks and deck fuel above. So, as the tanks go down sufficiently to pump fuel below, that’s what needs to be done. The impact of that is that the boat will spend rougly 2 weeks in the top area where the sight guages don’t read. This makes sight guages a good redundant check that we really like but they aren’t ideal as a primary source of measurement data in our configuration.
The second option we have are pressure sensors in the bottom of the tank. These are effectively measuring the weight of the fuel above the sensors and, knowing the density of diesel, surprisingly precise level numbers can be produced. This is our primary source of data but it’s far from perfect. The sensors are +/-3% accuracy over their range (0 to 3 PSI). When we check the levels measured in flat water between the sight guages and the sensors, they appear to be delivering results far better than +/-3% but, generally, banking on more is probably a mistake.
Other sources of error on the pressure based sensors are: 1) as the boat heals, the distance between the sensor and the fuel surface changes, and 2) the density of diesel changes with temperature. We limit the impact of heeling but a combination of averaging out level over short time periods to find the “central” position. In addition we track boat trim (this central averaged value) and pump fuel to maintain zero heel. The latter issue, the changes of fuel density could easily be taken into account by doing fuel temperature level correction but the other sources of error appear to dominate so I don’t bother to do this. The net after all the errors aggregate is the pressure based level sensors are +/-3% to 4% accurate. This is relatively very good but, absolutely, still represents 81 to 108 gallons of uncertainty.
The third measure we have available to us on Dirona is the engine control unit (ECU) estimate. Modern electronically controlled high pressure common rail diesels are incredibly precise and they know exactly how many injections events have happened and precisely how much fuel was injected on each event. Amazing. We have found that at rated RPM, the ECU produces a number you can take to the bank. They just about exactly match the fuel measure at the pump on a subsequent fill. But there is a problem here as well.
You would think that, with the ECU answer, the problem is solved and we know our exact miledge. Sadly, it’s not that easy. Engine manufacturers measure their engines very precisely at the rated RPM and power output and, consequently, the data produced at these power levels is very precise. Impressively so. But at lower power levels, the tables used by the ECU to produce estimates are checked much less carefully. So, on our engines down around 1500 RPM, the ECU estimate is off by 13% to 14% which, on our current fuel load, is 352 gallons to 379 gallons. Fortunately it reads conservatively so you won’t run out but you also won’t be able to successfully push the limits of crossing distance as we are doing right now. You need the “missing” 352 gallons.
Where does that leave us? With expereince we learn that the variability of the pressure sensors is roughly envenly distributed. So, over time, this estimate doesn’t accumulate error. It’s always around 3 to 4%. The ECU number is very precise at full load but not at all precise at the low loads used to go very long distances. But the ECU error is nowhere close to evenly distributed. Most of the error is functionally dependent upon RPM and load and appears to be near linear. Since we are using a fixed pitch prop, load is functionally dependent upon RPM. By running for multiple days at 1500, we know the ECU reading at that RPM (and load) is reading just over 13% conservative. We know at 2100 RPM it is reading just about precise. And sampling shows us that it’s close to linear in between. I suspect the error continues to increase at lower RPMs but we haven’t investigated down there.
Using the observations on the nature of ECU error being mostly functionally dependent upon RPM, we produce a 4th fuel level measure. We take the ECU based estimate and and RPM and and the error measurements we have produced above to produce an estimate of fuel burn that is, by far, the most accurate we have. We take ECU fuel burn and RPM and use linear interpolation to produce a corrected number where at 2100 RPM and above there is no correction. At 1500 RPM and below, the corection is a fixed 13%. In between 1500 and 2100 we use a linear model.
This computed fuel economy based upon the ECU number and RPM is remarkably precise and it is the primary data point we use for setting boat speed to get the needed economy. As a backup to verify the accuracy of this number and to detect engine problems that could cause more fuel to be burned, we use the pressure sensors to detect any accumulating computed fuel economy error. And, as a final check, we use the tank sight guages.
The above approach gives us a fairly accurate measure of real time fuel economy. We use the computed ECU number to set the boat speed to the needed RPM. In fact, I have two lights on the dash that both show green. If conditions change and the economy starts to slip, then a red light will come on saying “sower”. If currents turn favorable overtime or other conditions improve, the other light will come on orange and say “faster”. The lights makes driving the boat easy. We set the reserve fuel we want to complete the trip, the length of the trip, and the system computes needed speed and lets the operator know when the speed should be changed.
The number we show on the web site is based upon the fuel tank levels measured using pressure sensors. I estimate this system to be +/-3 to 4%. When pushing very long distances, even tiny errors can be the difference between making it and not. These data are currently showing “not making it” but are converging on the needed economy of 1.5nm/gal with reserve. The computed ECU based sensor shows us hitting this number but the fuel tank level based sensor error is showing we don’t make it. Clearly a concern but when even tiny errors make a massive difference, these anomolies are unavoidable and some judgement is still needed.
I don’t like not having a precise measure of fuel levels on the boat. The pressure sensors have been performing very well and are wildly better than the sonic sensors we used before. The computed ECU number is also very good. But, we would like even more precision so are considering installing flow sensors to see if we can get an measure more precise than compouted ECU or pressure based tank sensors.
I’m generally happy with our current fuel tank measures but continue to think that more precision should be possible and we will investigate fuel flow sensors in the future. Perhaps an excessively long way to say “we think we can make it but there is error in the data we are using and we are always watching and comparing these redundant data points to ensure we can make the full 3,650 nautical miles we need.” Better data means less worry so we are always looking for more precision.
Thanks James, that gives me something to chew on.
I had forgotten your go faster/slower lights. :)
The problem you describe is seriously analogous to aircraft operations, however we are blessed with more accurate FF and quantity gauges.
We do run a manual fuel log or audit of fuel on board and loaded from the bowser against en route fuel burn and final readings at engine shut down at the destination as a fuel gauge check.
A Gulfstream MTOW 42,300 kg for example might burn 18,000kg/22,500liters/6000usg over 6000nm with fuel representing towards 50% of the take off weight for a nominal sgr of 22500/6000 = 3,75 l/nm or around 1usg/nm so the energy equation is not so different.
In absolute terms we share the same principle in that barring leaks, there is only one way the fuel can go off the boat/aircraft and that is through the engine.
You know how exactly much you put on board so whatever is left has to be the remainder of what has been burnt. The problem you describe being the “accuracy” or not of the ECU fuel flow metering. As you say small percentages applied to such large volumes rings the bell.
From where I’m sitting I’m seeing you reasonably happy with the ECU number, which applied to the known fuel loaded suggests its doable and that the “tank indications” are only “interesting” at this stage . It seems likely that by the time you have emptied the bladders and have achieved the equivalent of full standard tanks, therefore a “known” volume, everything will come into focus. Certainly in plenty of time to review the situation and at first glance you have a few diversion options.
Keep chasing the required sgr or needed economy of 1.5nm/gal with reserve.
As we get closer to the destination with a dodgy fuel or weather outcome suggesting a need to divert, we would run a latest point of safe diversion (LPSD) calculation, around which I will need to get my head in the marine context, because there is a wind component which can be removed.
The LPSD is the point at which you should divert from your present track to an alternate destination, if you cannot be sure for whatever reason of making the planned destination.
A Last Point of Safe Diversion (‘point of no return’) is a fuel flow v fuel qty available problem. How far can I proceed from my point of departure ……
Leave it with me and I will have a rummage around with the problem, you can also as we used to, plot the solution on a chart.
A Last Point of Safe Diversion (‘point of no return’) is a fuel flow v fuel qty available problem. How far can I proceed from my point of departure ….
Super interesting Gary. Unsurprisingly, there many parallels between fuel management on boats and planes. In fact, it’s from conversations with a pilot that I’ve gotten interested in installing flow sensors. I’m pretty happy with the tank level sensors and don’t expect I’ll find any way to get tank levels much more precisely measured. What I need is accurate flow sensors and what I’m using as a proxy for now is the engine ECU consumption numbers with a correction function. What we have is generally accurate to small single digit percentages but I’ll still investigate flow sensors.
Loved your data point on a fully loaded Gulfstream carring 22,500 liters. It can carry twice as much fuel but it can also go twice as far as well. Where you have me beat is it’s a bit faster :-). If I could afford one, I would be highly tempted. The problem with planes is, once you get good carrying capacity and very long range, it’s a pretty expensive vehicle.
As you recommend, we do have numerous diversion options on this run. The combination of multiple sources of data on how much fuel we are carrying coupled with good experience with these measuring devices and diversion options is what allows us to take on a run of this length. Based upon what I’ve seen so far, I’m pretty confident that we could hit 4,000 nm in these conditions. It’s the external conditions like negative currents, bad weather, head winds, and mechanical issues that can cause predictions to not work out. All problems that the aviation community deals with daily. Thanks for the background from your flying experience.
James,
I like the Red/Green N2K alert for Fuel Economy. When you say ” I have written software that tracks distance left and fuel left on the trip and keeps an up-to-date fuel economy goal. ” how have you incorporated this into N2K? I have N2K and was not aware how you could program alerts like this.
Its interesting that the autopilot tracks a NAV course but (on my boat at least) all the throttle stuff is by hand. Its the same in an aircraft where the debate often rages about pushing harder through the headwind so you spend less time in it always loses to the low and slow (and further up the economy curve). Many aircraft deliveries to Hawaii often show fuel exhaustion half way on the trip (in headwinds) only to rely on the favorable winds on the second half of the trip. If Ocean current forecasting was better, this might be an option. I have often wondered whether the sail route optimization programs (for picking courses with favorable winds) could be adapted to motor boats and wind/current for auto routing. Instead of a polar diagram for sailing we could plug in fuel economy curves for the optimum routes. If ocean current data was accurate enought, it could provide a benefit (especially when coupled with your N2K target economy light!).
Peter, you were asking how the N2Kview “faster” and “slower”lights are programmed. These lights actually operate in two modes: 1) drive to economy (fuel mode) and 2) drive to deadline (time mode). For the 3023 nm run into Rodrigues we ran in fuel mode and arrived as planned with 200 gallons left in the boat. In the run to Reunion, we ran in deadline mode since fuel economy wasn’t the goal and we wanted to arrive at 7am. Both modes work much the same way and are controlled by the same software. I have code that every second recomputes current fuel burn and remaining distace or current speed and remaining distance and then either warns “slower”, “faster” or leaves both lights green indicating we are running within +/-5% of the goal.
You were specifically interested in how we were able to control lights on the N2kview display. Maretron n2kview is able to show lights indicating the current state of a SIM100 (Switch Indicator Module). I’m using a virtual SIM100 as input into the system in this case.
I really like the user interface of the Maretron N2kview system and so, rather than discrete lights on the dash which I could have done, I show the lights on N2kvew. I have warning lights for propane on, water heater cold, high battery dischard, frequency of shore power, satelite internet connectivity, external alarm, secondary alternator engaged, HVAC load sheded, H/W heater load shedded, generator autostart on, and generator high load. I have a generic Chk light that is used to signal interesting events that need investigation like main engine off but generator autostart not on, errors in other software systems on the boat like inability to write to the database or other unexpected faults, alarm acknowledged but not cleared, watch alarm soon to sound, etc.
Over the years, I’ve become a pretty big fan of the Maretron system and we have a lot of Maretron sensors deployed and use N2kview extensively. Much of the above is my software that is just sending signals to N2kview indicators but, even when I’m doing it myself, I find the n2kview display so flexible that I use it for most of our display needs.
The debate on whether to power through negative current or wind rages on in the boating world just as you described in the air transport world. Personally, I’m a pretty big fan of staying within the bounds and not powering through negative current on the blief that the faster it’s done the faster you are back to getting good fuel economy.
My logic goes like this. From idle to full power, boat speed increases but far slower than fuel consumption increases. When the boat was commissioned Deere did a two way instrumented run of all engine data at all RPMs from idle to WOT. Using that data, slower is always better from a fuel economy perspective. Using that data, I can’t figure out how throttling up can do anything other than burn more fuel. However, as you said, the debate rages on so there must be good arguments both ways.
Our chosen operating mode is to run to required fuel economy on ocean passage and not to push hard through negative current spending more fuel in the hope that latter the conditions will improve and statistically it’ll all just equal out. However, I have to admit that those that adopt this latter approach seem to arrive fine too and likely will sometimes get in ahead of us.
James,
I have just discovered this amazing site yesterday, from an article in the latest Passagemaker. I have much, much reading to do, but I hope you have a minute to answer just one question for now. What software is displaying all of your data from engines, tanks, electrical systems, etc? I gather that it’s some view of, or some derivative of, the Maretron N2KAnalyzer – but on Maretron’s website, I can’t find any images that are remotely like the view you have shown screenshots from. It looks fantastic! And the fact that you’re able to program it to show exactly what you want is even better (I do a little programming myself, so this isn’t a scary thought).
If there is an article or blog post about it, I haven’t been able to find it, so I’m resorting to a direct question here.
BTW, my wife and I just closed on our new home – a 53′ Kristen steel hull trawler, on which we will live and explore the Caribbean, starting in about 10 months, so your website is going to be a source of solid gold information for us!
As Roseanne Roseannadanna used to say on Saturday Night Live, “Nevermind!” I poked around the Maretron website more and found N2KView. So cool!
Exactly. You’ll love n2kview Brian.
It’s N2kview that you are looking for. It’s a very nice software system that we just continue to like more each year. Highly recommended.
Congratulations on your new boat.
Hello James,
What great information, but I’m a little confused or I have terribly over simplified this in my mind. I have your same engine but I have two in a 54′ 90’000 lb trawler. I believe I have studied my fuel consumption very closely and I have mostly stopped paying attention to gallons per hour GPH and started focusing on miles (over ground) per gallon (MPG). I use too use my ECU fuel burn numbers, but I convert them to MPG. My thinking is I have a fixed number of miles to cover and a set amount of fuel with which to do it. If we’re on a run when range is more important than time, my goal regardless of current or swell is to run at the greatest efficiency in MPG and let the speed be whatever it is. Your focus on GPH and not MPG surprised me, am I missing something.
Yours and Jennifer’s travels continue to inspire!
God Speed,
Bob
Your right Bob, we report gallons per hour as one of the trip summary statistics because people ask about it but we drive the boat on MPG.
On the Maretron N2kview display in the center of the dash we display current nautical miles per gallon and I’ve programed two dash lights that both show green when operating at or near the correct fuel economy. If we start to burn to much to distance, the one on the left goes red. And, if we are burning too little and could go faster, the one on the right goes orange. We effective “drive the lights” on long passages since all we really care about is getting there and not spendintg too long at sea.
You can get see the lights in the bottom, right hand corner fo the N2kview display visible towards the end of the post. That approach allowed us to do over 10 kts over the Tasman sea and forced us to do less than 5kts at times othe run south east to Marguassas in the South Pacific. Both extremes driven by unusually strong ocean currents
James,
Please allow me to add a post script to my comment/question above while simultaneously tying it to your post on engine loading.
While we attempt to run the most efficiently, that is also assuming we are running at what we believe is an acceptable load on the engines. In hindsight in designing our boat we over powered it a little. At our average cruise speed/rpm we run at about 35% load. Our goal is to keep oil temp above 185 degrees which keeps our coolant temp at about 175 degrees. I will gradually run up to WOT and gradually bring it back down over an 8 to 10 minute period about every 20 hours of normal cruising. So our ultimate goal while keeping the load and temps at an acceptable level is to try to achieve a minimum of 1.5 MPG with an ideal of 1.75. As you have noted the speed can vary considerably (for us that’s any where from 6-8 knots) depending on current and swells while trying to stay at these fuel efficiency numbers.
To your thoughts on engine loading, do you think it’s harmful to run for extended times below the load/temps I’ve referenced? While I generally agree on your lack of concern for under loading, I have believed the engines should run at a minimum oil temperature.
All the Best,
Bob
Bob, your overall goal of keeping oil and water temps in the normal operating range are important. We do the same. I like the coolant above 175 and the oil around the same. I actually like both warmer but I’m fine with operating at these temp levels.
We have been lucky in that all the diesels we have owned operated at these reasonable temp levels when under light load. If they didn’t, I might get tempted to make changes to increase oil temps. But, in the end, when you are doing a long crossing, you have to drive the required economy. You can give the engine short periods at higher load but, to make the distance, you will have to keep operating on the low load side.
In marine applications especially in planing boats, overload kills more diesels than under load: //mvdirona.com/TechnicalArticles/DieselEngineOverload/AvoidingDieselEngineOverload.htm
Generally we like having an engine that can run the boat at high speed to length ratios for days at a time so we sized the engine in Dirona to be able to run 230 HP continuously. This allows us to run at 9.5kts and doesn’t reduce our fuel economy at light loads. However, it does mean we sometimes operate at very low load levels. Our general apporach to low load operation is at: //mvdirona.com/2015/08/diesel-engine-underload/
The main engine in Dirona actually averages a fairly high 43% of max output which includes warming up, cooling down, moving through marinas, etc. The fact that we average 43% of the engines max output shows that, even though we do long, low-load runs, we also run at higher loads quite frequently. Generally, even for boats that are crossing oceans, the crossing ocean hours are only a small part of the boats overall use.
James, congratulations on a trip well done. I note that Dirona’s total fuel use is just about our own boat’s standard fuel capacity. We are a twin engine 55 so our hull is a little less efficient but the differences we’ve found between full and empty trips equate to almost an extra gallon per hour. Clearly you arrived in a different boat than you departed and I think that may help explain some of the extra fuel. Btw how many hours did you log on your generator for the trip and how much water do you think you carried on average?Ed
We like to carry nearly full water tanks on the thinking that, if a water maker were to fail a thousand miles from shore, we want as close to full tanks as possible. This means we are usually carrying 300 to 400 gallons. That’s 2,400 to 3,200 lbs that is being dragged around primarily for insurance.
On Air Conditioning usage, we ran two units for the entire trip. When they are both on, that’s roughly 11A @ 240V or 2.6kw. That’s a roughly 4hp load that strictly speaking isn’t required. That’s nearly 5%.
So, were we strictly focused on fuel economy, you are right we could have easily gained something close to 5% by carrying less water and not running the A/C. But, we chose comfort and are willing to run slower to gain comfort and the insurance of having a big load of water.
You asked about generator load. The way the power system on Dirona is set up, the main engine can produce 9kw of power so, although we run the air conditioning and use the clothes dryer and oven, we don’t ever actually run the generator underway. For more on our power system design, see: //mvdirona.com/2014/08/a-more-flexible-power-system-for-dirona/
James, Great information, thank you. Did you really have 800 gallons of deck fuel at the start of the voyage, or is my math poor? Mark
I hear you Mark. It is a big fuel load for a small boat but, yes, we left with 839 gallons on deck. Just a splash :-).
Thank you for sharing your thoughts.
I was waondering wht the most economic speed in a current is. Obviously the range will not further increase in a current on the bow when you slow down too much.
I made a Little computation for say a 3000nm trip. Half of it with current on the bow, half of it with current on the stern. I made some simple assumption on the fuel versus speed curve The results are the following:
@ No current, 6.6knots, 455 hours.
@ +/-1knot current with constant rpm you have to slow down to 6,625 knots (through the water) to use the same amount of fuel. The trip then takes 471 hours.
@ +/-1knot current with optimzed rpm you Speed up to 6.83knots through the water against the current and slow down to 6.15 knots through the water with the current. This burns the same amount of fuel and the trip takes 467 hours,
For me that means, that if you do not expect a head current all the way you might rather increase your rpm a bit. You should easily make up for it, when conditions change. One could run a full optimzation if one would no the current Speed on the whole trip in advance. What James found however that this is not available.
Gerhard
Gerhard, that’s a great question and one I have seen argued both ways. I can’t prove my perspective but I’ll lay out my argument.
Here’s what I think we know: 1) going faster through the water takes more HP, and 2) HP is very nearly linearly related to HP produced (you get roughly 20 hp per gallon per hour).
We also know that increasing speed over ground has exponential costs where the exponent really kicks in as you get near to the speed to length ratio of the boat. At very low speeds, doubling speed costs just a bit more than double the HP. But, as you approach a sizable fraction of the boats speed to length ratio (often called “hull speed”), the costs go up dramatically. It costs exponentially more fuel to add a knot to a 50′ displacement boat at 8 kts as it does to add a kt to the same boat at 3 kts.
Summarizing the facts as I understand them: faster through the water comes at an increasing cost as the speed goes up and it becomes highly exponential at high speed to length ratios.
Looking at the nautical miles per gallon of Dirona at all RPMs from idle through to max RPM, the best fuel economy is at idle and the worst is at rated RPM. Each increase in speed is matched at first by a slight reduction in fuel economomy. And, as Speed to length ratios approach 1.0, the fuel economy reduction of increased speed goes up quickly.
When we are faced with a negative current, we have to consume HP to go faster through the water to maintain the same speed over ground as when we didn’t have the negative current. In effect, maintaining speed over ground is going faster through the water. And, going faster through the water requires more fuel so it appears to me that slower always wins.
However, it is clear that as the speed of the boat drops down below the speed of the current, it’s clear that eventually all progress will stop and eventually you would be spending fuel to go backwards which is a clear lose. So, there is a point below which, the argument above is clearly incorrect.
It’s both a hard and a very interesting problem. Our approach is approach negative current by maintaining the trip required fuel economy rather than increasing speed to “get it over with” but I’ve seen good arguments both ways.
Hello James,
when I did the little calculation, I assumed that fuel consumption would rise with the velocity cube. That is Close to real when you stay significantly below hull speed. I actually had expected a more pronounced effect on the most efficient velocity. It is still only a few hours on a 3000 mile trip with half of the way good and bad current of a knot. So obviously it is much less than the effects of wind and swell. In the end there is not much practical use of the discussed effect. River barges of course here on the Rhine typically use only half the installed power when going downstream to save fuel, but there the current is stronger and everything else is negligible.
Gerhard
Your calculation based upon velocity cube sounds at least directionally correct. Continuing on your thinking, I’ve read a lot about boat owners seeking out the “sweet spot” where fuel economy is best but in all our careful measurement idle is the most fuel efficient and wide open throttle the worst. There really does’t seem to be a sweet spot in between or I’ve not been able to measure one. It really seems like you are mostly paying for displacment and speed and more of either costs more fuel.
Is that a simon monitoring system? Very nice setup
Ariel, it’s a NMEA2000 system with the vast majority being Maretron gear. Maretron is a fraction of the cost of dedicated monitoring systems like the Simon and we’re finding the Maretron solution remarkably flexible and fairly cost effective.
I really like Maretron and we have a lot of it on Dirona.
James,
I have read your blog(s) about your usage of the Maretron System, but I was wondering what is your base Maretron system (Black Box, N2kview on laptop/destop, displays, etc…)\
Clayton
I view N2kview as the center of the system since it’s what shows all the data, indicators, and alarms. I run N2kview on the windows based nav computer and also on various Android based systems throughout the boat. They all run the same screens. All the n2kviews get there data from an IPG100 either over a hardwired ethernet network or over WiFi.
Very cool information and gives us all something to look at as we do our thing.