When we go to sea in Dirona there are usually only two people on the boat. That means automation and reliability are super important to us, and we want early warning of problems or unusual conditions. Maretron N2kView is a good-value display system that has worked very well for us and allowed us to incrementally expand what we monitor over time. This system monitors the NMEA 2000 communications bus to give us visibility into almost every instrument in the entire boat, including navigation equipment, weather instruments, main engine, wing engine, generator, depth sounders, inverters, chargers and pumps.
Maretron N2KView is an unusually flexible and well-engineered user interface. Our inclination is to write apps ourselves or use open-source software. But it’s amazing what you can do with N2KView, nothing comes close to it on price, and it would be hard to duplicate the clarity and information density using open-source software.
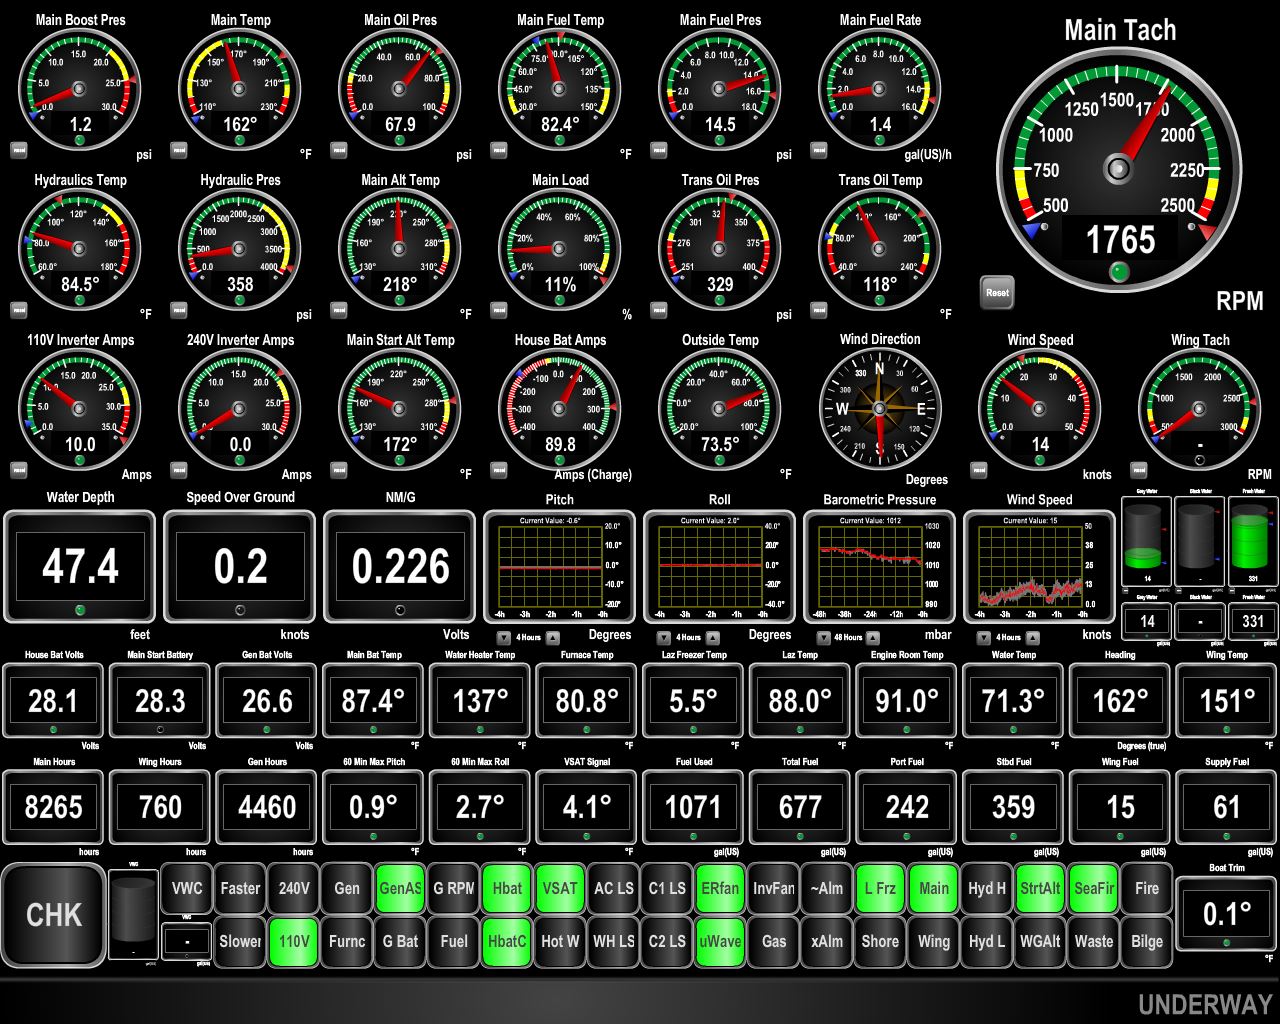
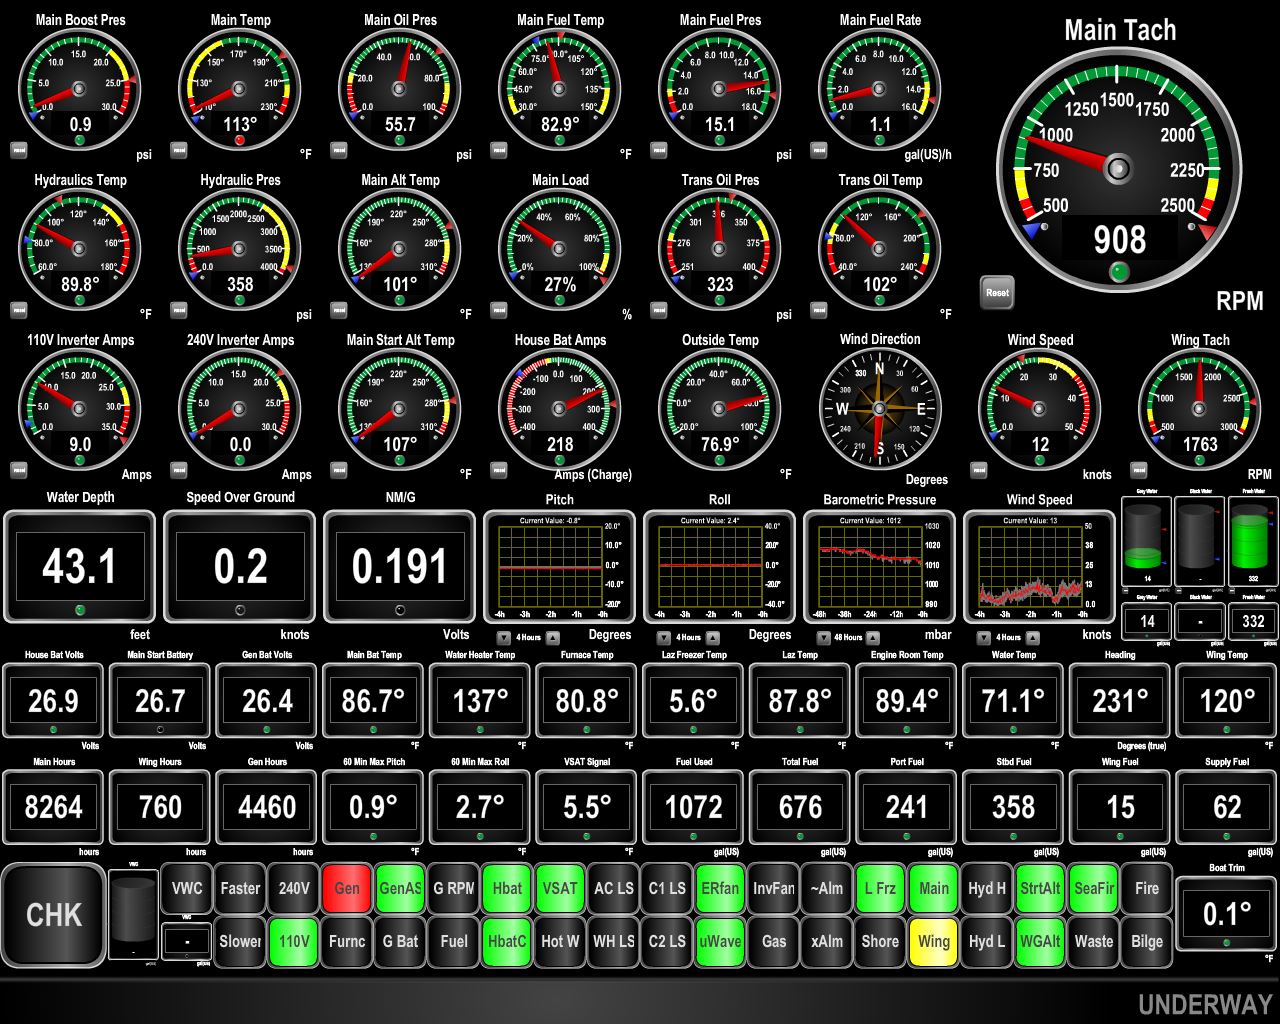
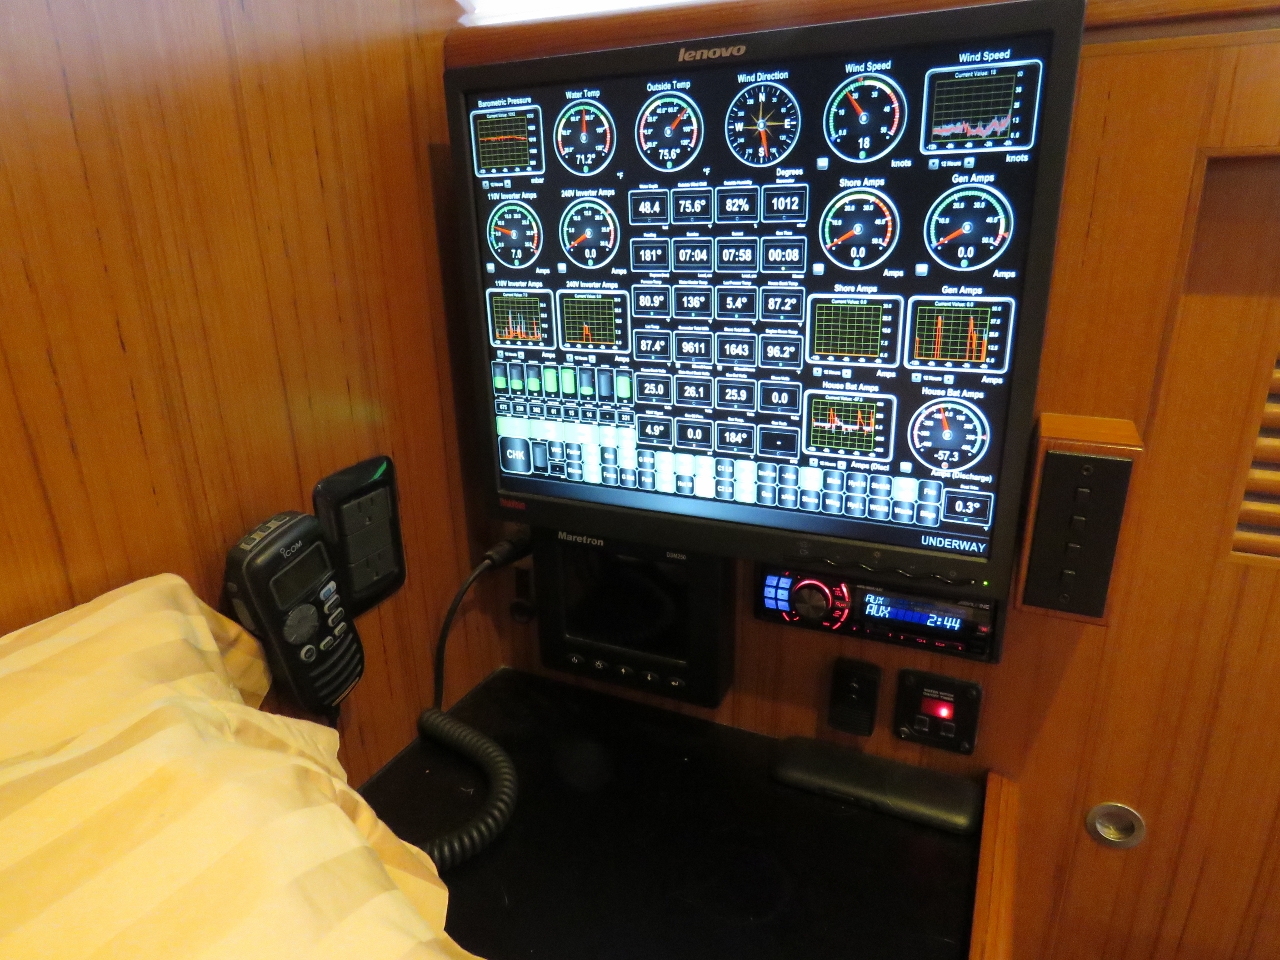
We’ve designed several displays in N2KView. At the top of this post is the display we normally use when underway (click any image for a larger view). The displays can be configured almost any way desired. Of the three things that we focus on, the first is that we want it to be easy to use even when tired or managing difficult weather. It looks complicated, but in fact the first-level read is just scanning for green lights at each gauge and checking there are no yellow, orange, or red indicator lights. As long as we’re seeing nothing but green lights we know the boat is in good shape and everything’s functioning properly. It’s an easy quick check that we can perform quickly and frequently even when tired.
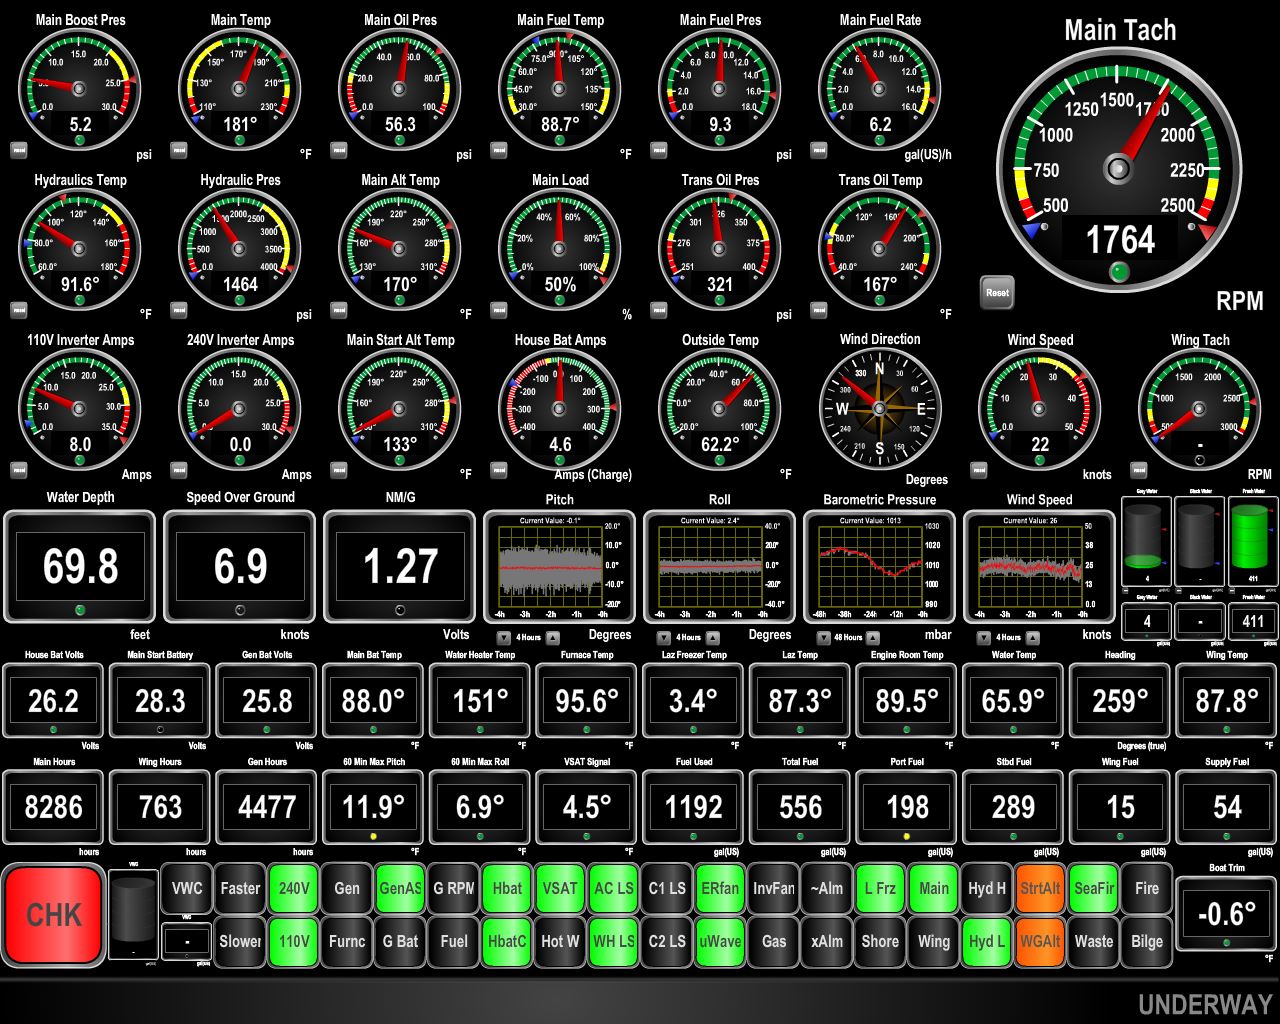
If something goes wrong we want to know immediately and have more information at our fingertips because we don’t particularly want to wake the other person up but we do want to take quick action. If an indicator light goes to warning, it’ll get noticed quickly and the detailed data to more fully understand the problem is immediately available in a gauge, graph, or numeric display. That’s the second level of protection that we’ve got using this system. For example, the display below shows two potential issues that are obvious with a quick scan: 1) the engine temperature is out of normal range 2) the house battery amp draw is negative. The engine is running cold (top, 2nd from left) because we just started it. That small red light should go to first to yellow and then to green as the engine warms up.
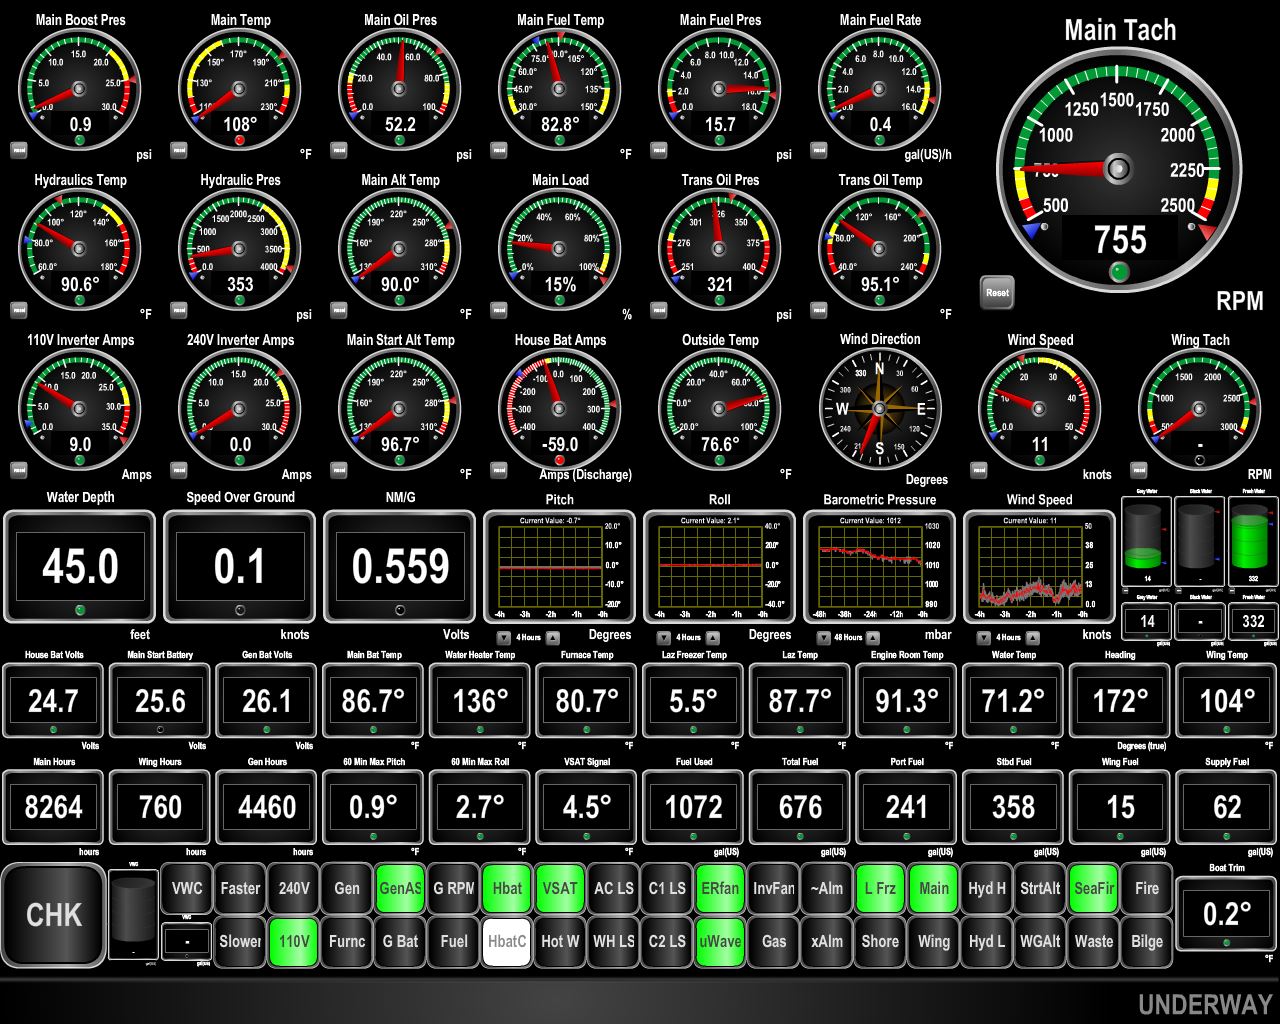
A second potential issue in the above display is that the house battery draw (middle of third row) is showing red, indicating we are drawing the batteries down. This would be a problem if it continues, so we can then dig deeper into that by looking at the historical display below to see if it’s been doing that for a while or if it’s just a spike.
The screen below shows two more examples of automation and simplification. The red light near the bottom left of the display indicates that the generator is running. We started all three engines to produce the screen shots for this blog, but in normal circumstances the generator should never be running while the main engine is running. The combination of our main engine able to produce 9kw of power and the 240V inverterter being able to run and of the equipment on the boat means we never run the generator when under way. We do use the dryer, the air conditioning, and the oven when underway but don’t need to run the generator (see A More Flexible Power System for Dirona). Consequently, we display a red indicator to notify us if the generator is on when underway (it’s quiet, so we might not notice it running).
Another potential issue is that the wing is running (yellow light near bottom right). This is not actually an unexpected condition. The wing is used to power our hydraulic thrusters and anchor winch so it’s usually on twice on every trip. But we don’t want to accidentally leave the wing running, so we display a yellow light to help us avoid leaving it running when not needed.
One thing we’ve found it that consistency across the displays is important for ease of comprehension and locating data. So we designed an indicator “ribbon” where the bottom two rows are identical across all the displays, including the CHK indicator. The same group of indicator lights is displayed in the ribbon. The general rule for indicator lights is they are black if the devices is not currently in use, green if in use and operating correctly, and yellow, orange, or red if on and there is some problem. The indicator lights are the same on every display screen so we can get use to the layout and it never changes. From the other side of the room, I can see that the propane was left on or the hot water heater is below 115F.
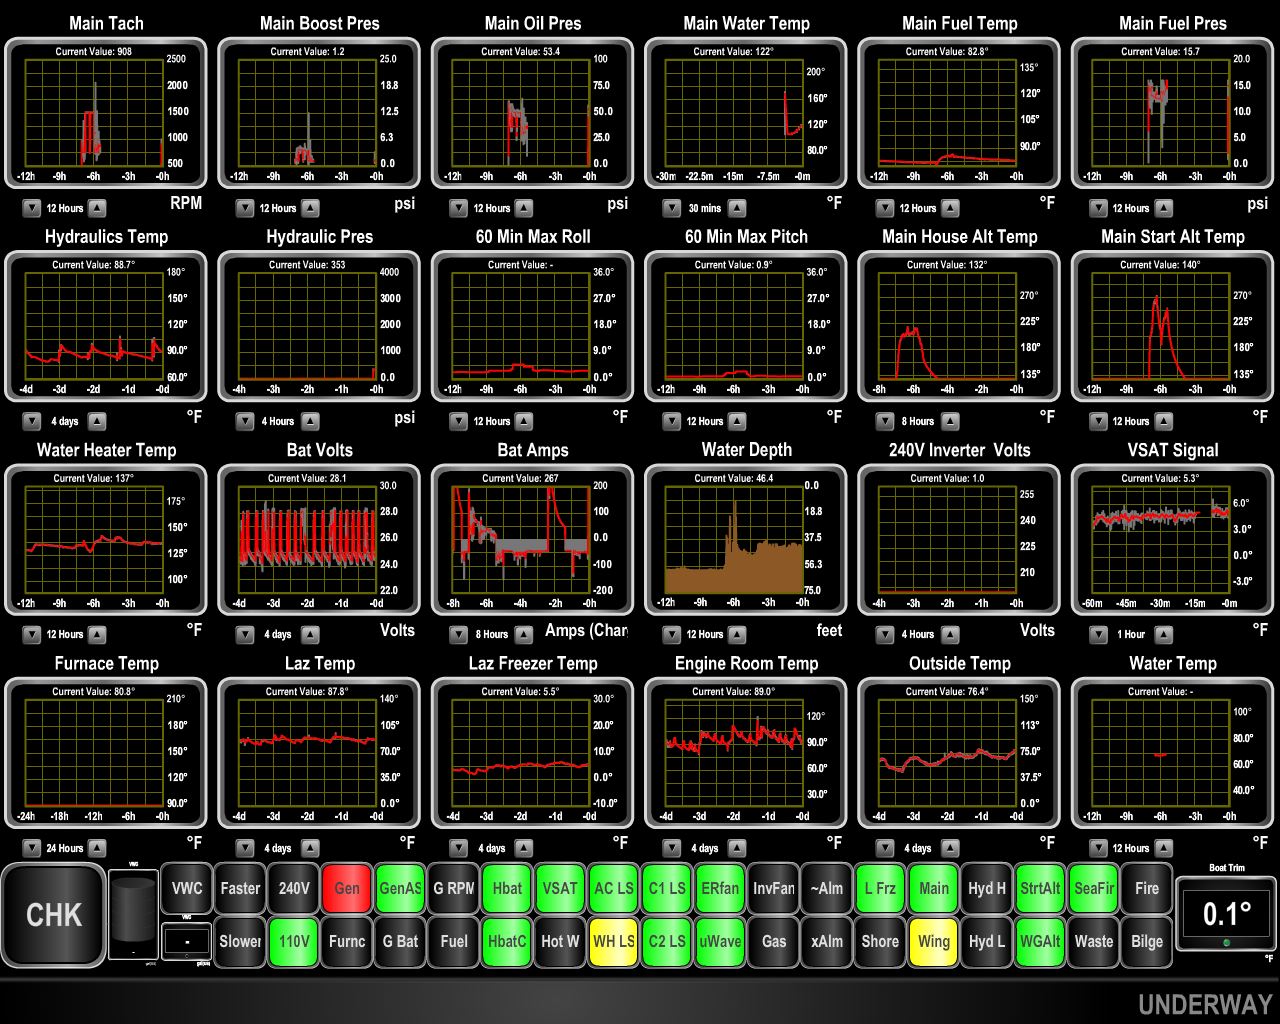
We also have a variety of conditions we want to flag that either don’t have a specific gauge or indicator light or we want to make them more noticeable when they occur. For these cases, we have the large check light in the bottom left hand corner of all display screens. This indicator is black for “no issue,” yellow for warning, and red for a problem needing more immediate attention. In the display below, none of the gauge indicators are red, but the red CHK light indicates a serious issue that we need to address right away. We’ll look at a separate display to debug the problem.
We have described the first two levels at which we use the display system: 1) warning indicator lights to flag anomalies, and 2) gauges or numeric displays to show more detail. The third level is a little bit unusual. We’ve written software that that pulls data off of the bus and stores it in a relational database. This allows us to check to see if the engine is running hotter than it did in the past in the same water temperatures or to see if the battery capacity has gone down significantly over the last year. We have all NMEA2000 telemetry stored every five seconds for multiple years now. Maretron has since introduced a device that supports this black box historical record so it’s now far easier to add this support to your NMEA2000 system. With the Maretron VDR100, it’s easy to have this support without going to the effort of a custom software implementation.
We’ve shown two of the Maretron displays that we rely on. In general we have the Maretron system showing one of two displays: the underway display shown above or the moored display shown below. The underway display focuses more on engine health and telemetry and anything else that matters when we’re underway. The moored display highlights data we care about more when at rest, such as weather conditions and inverter, shore and generator draw.

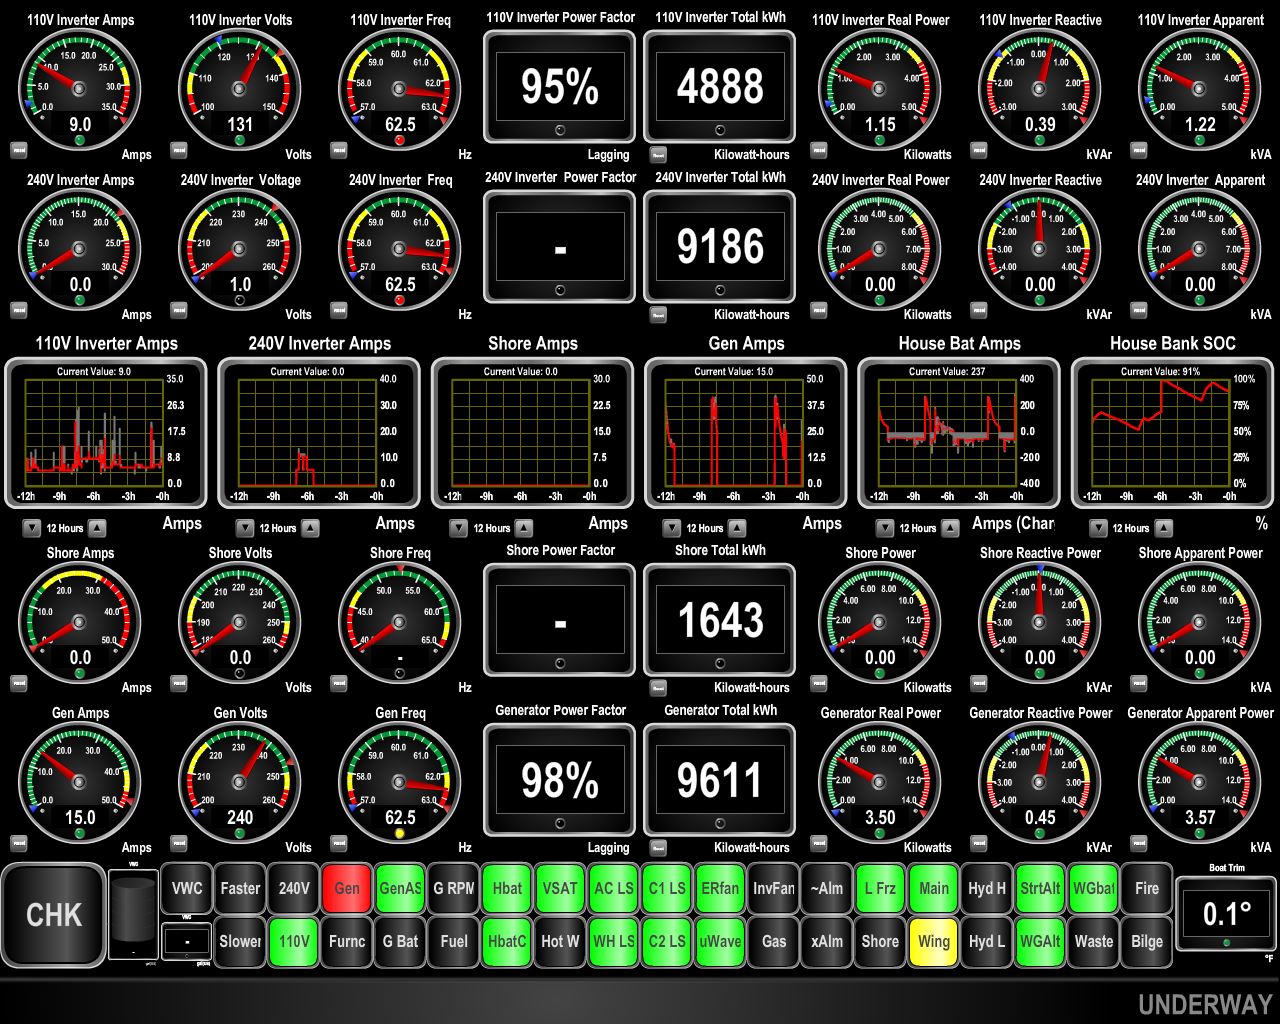
The other three displays that we’ve designed are shown below. The first shows data specific to the power systems and the second shows wing and generator data. We use these displays when we want to dig a little deeper into something specific to those systems. We use the third display when doing something specific with our tanks, such as refueling.
|

|

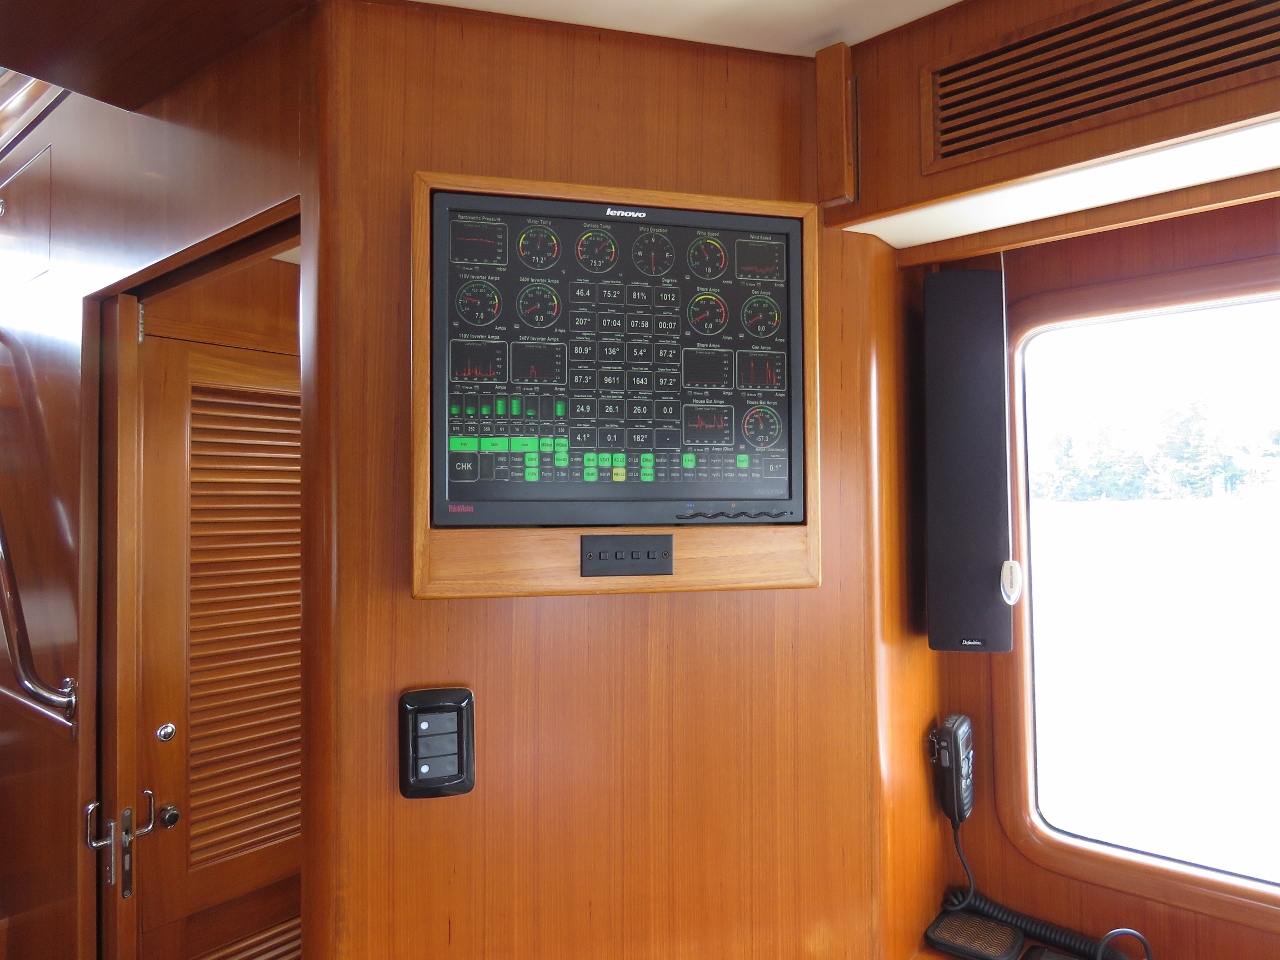
Maretron N2KView runs on our navigation computer in the pilot house. We also display the current Maretron screen on monitors in the salon and the master stateroom. These monitors simply mirror whatever is displaying on any of the four pilothouse screens but we usually show the Maretron display.
|
|
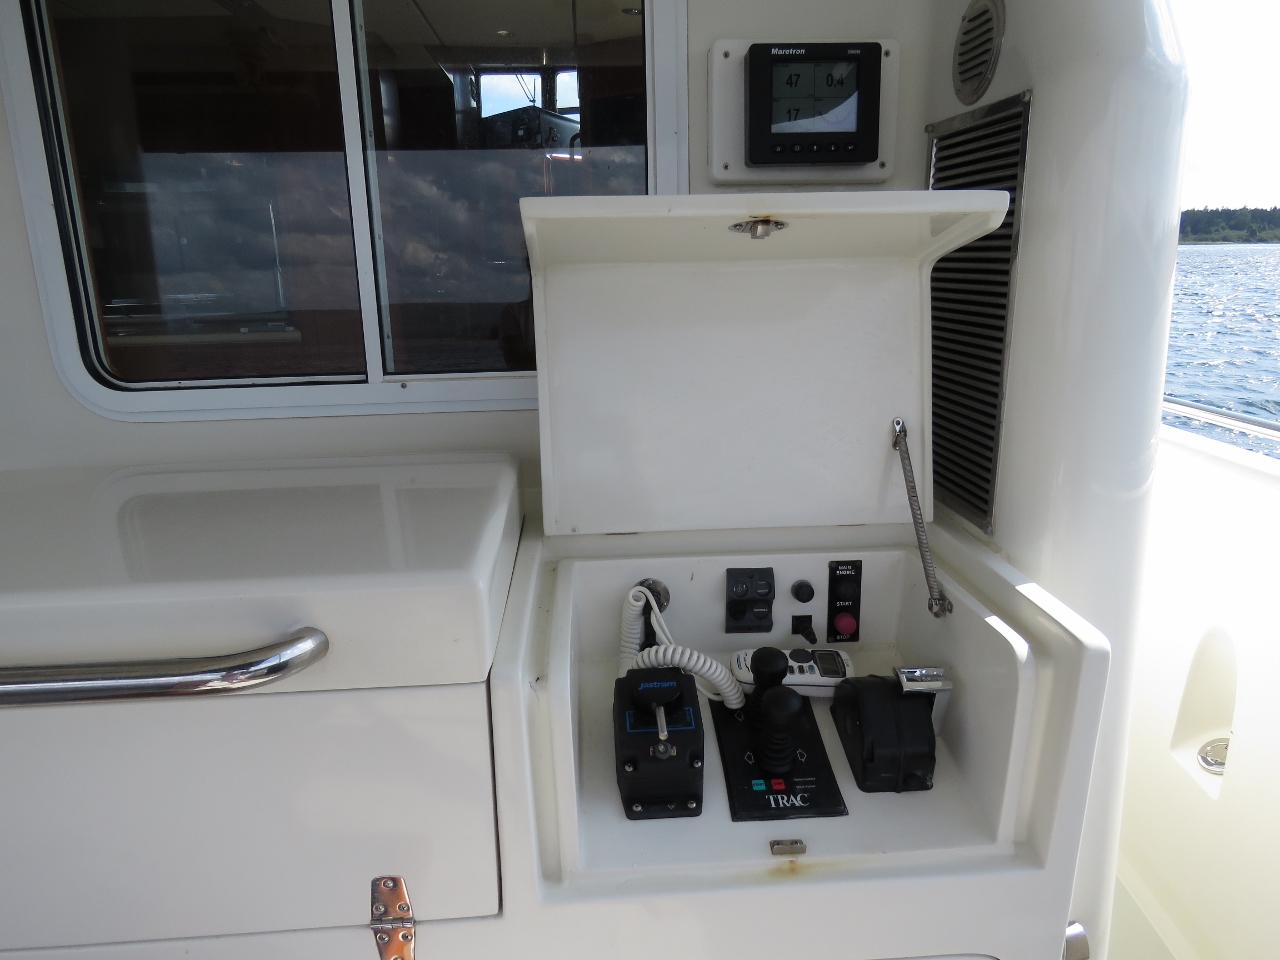
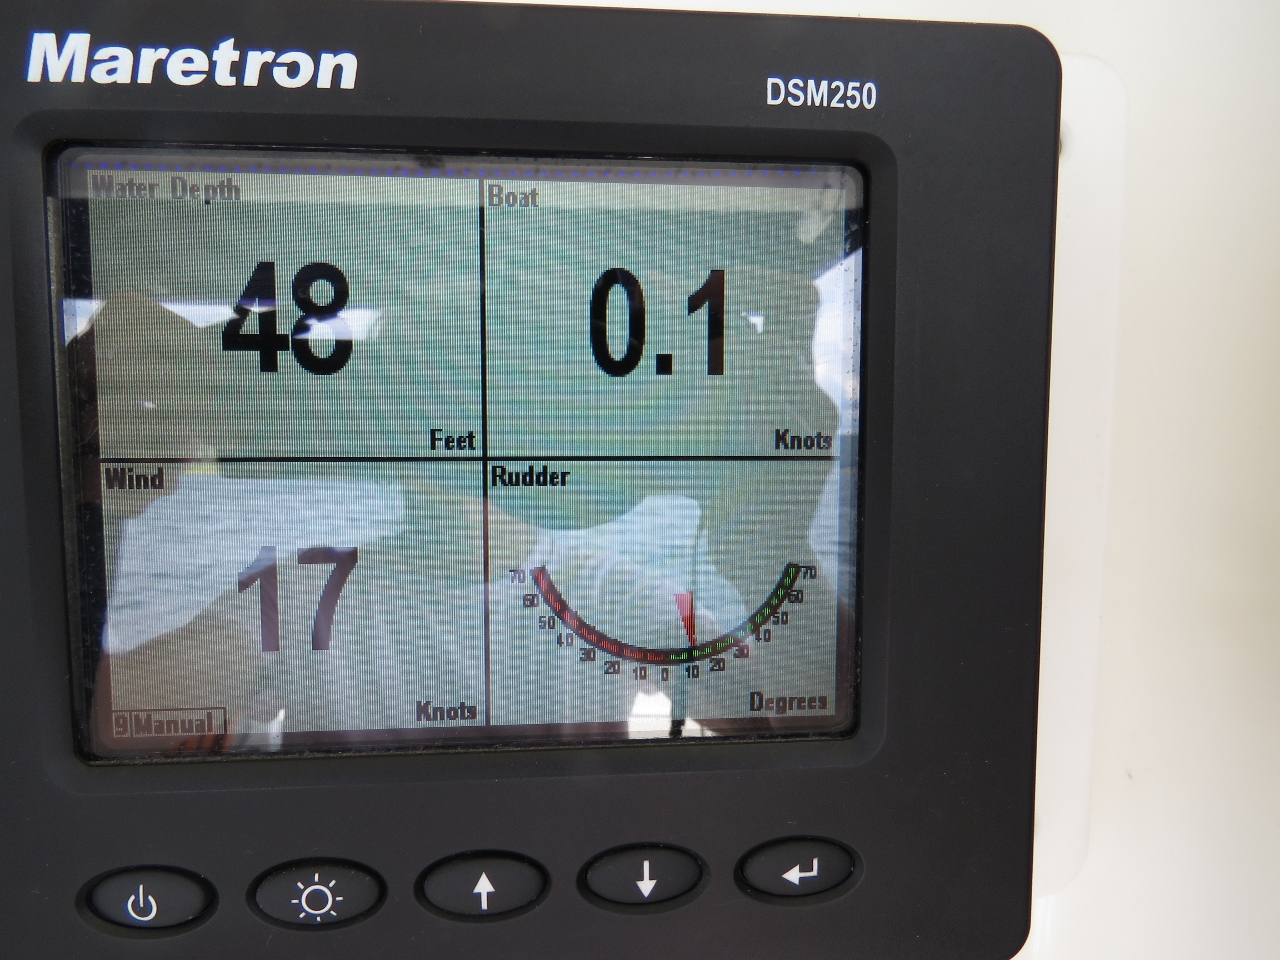
We also have several smaller Maretron-specific displays installed throughout the boat that hook directly onto the NMEA 2000 bus. At the aft helm and the flybridge we have a medium-sized DSM250 that displays navigation-specific information.
|
|
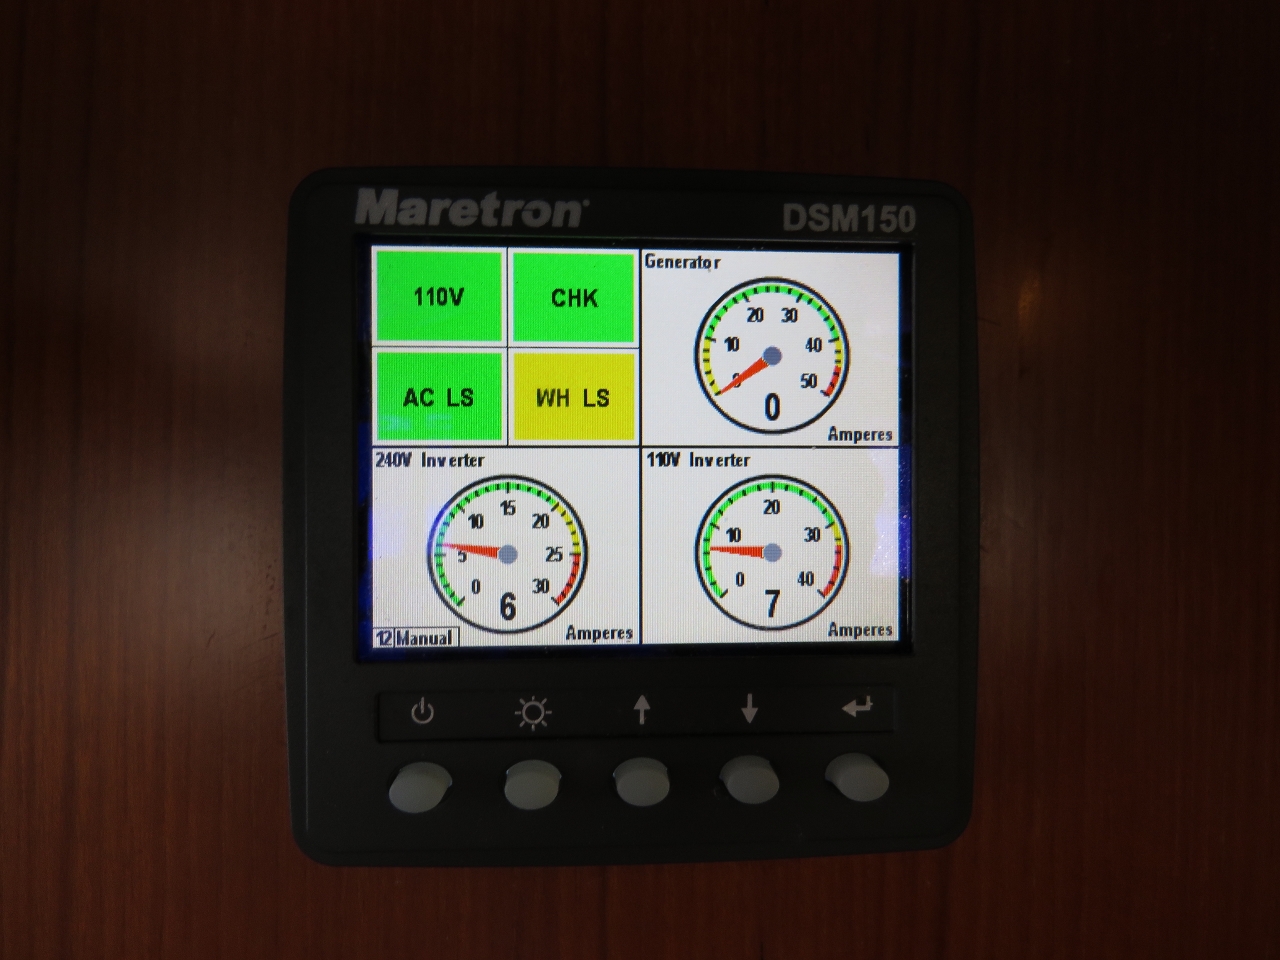
In the galley, a small DSM150 displays power-specific data. We use it to avoid overdrawing the 110V, 240V or generator. In a future article we’ll cover the load shedding system that automates power management and allows the user to just use appliances without having to worry about what other loads are currently in use. The auto-load shedding system just turns off the water heater or other less time critical power draw to keep everything else running. The yellow indicator light and the green one beside it in the image below indicate if the A/C or water heater loads have been shedded to prevent overdrawing the 240V system. These same indicators show on our ribbon. And the CHK box above the yellow box is the same big yellow/red check indicator as in the ribbon, so if the person on watch is in the galley they’ll see the problem right away.

|
|
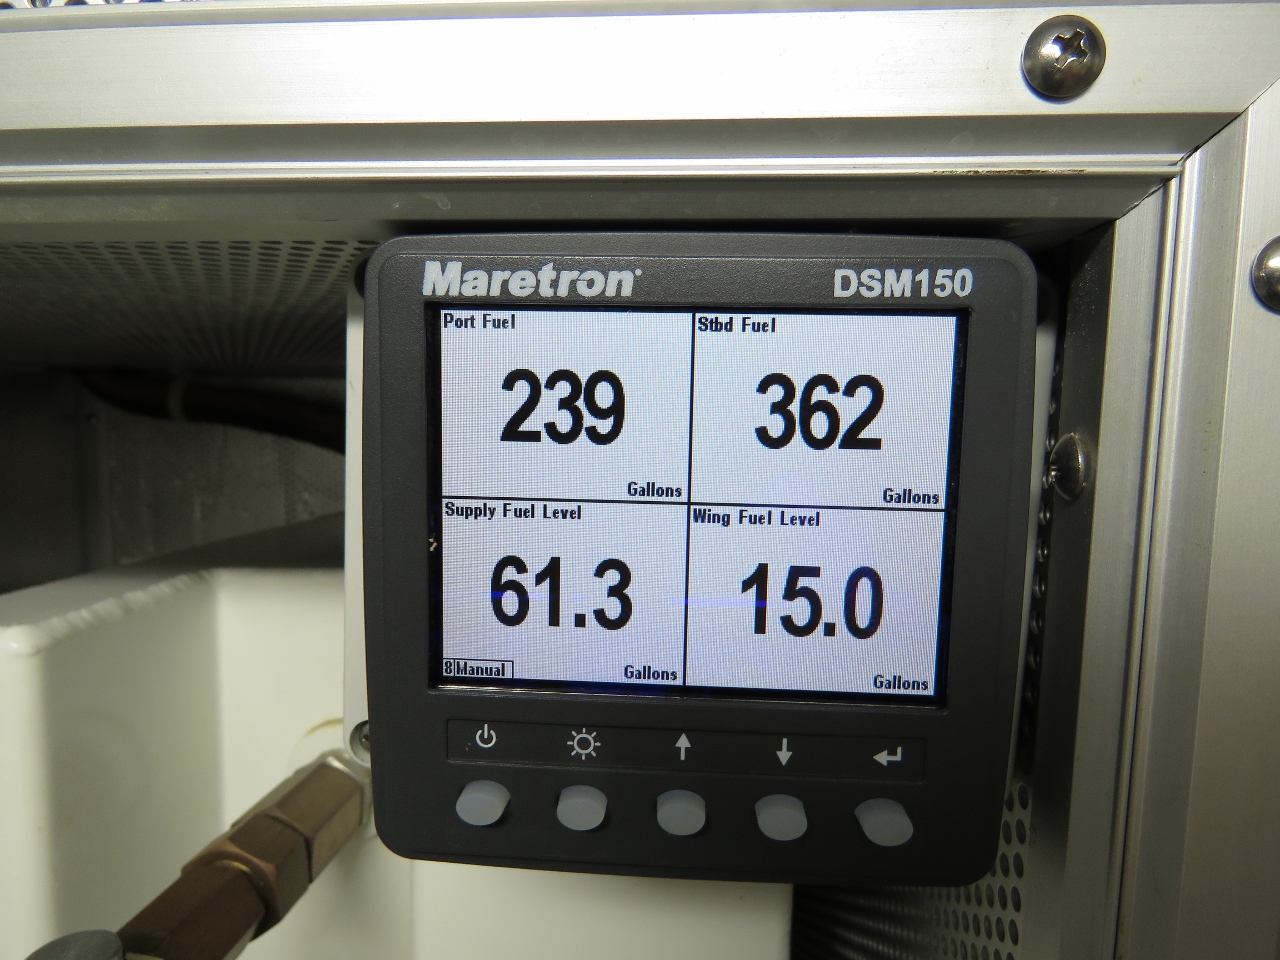
We have a second DSM150 in the engine room mounted above the supply tank. This displays fuel tank levels of the four fuel tanks on Dirona. We use this data when transferring fuel and, during engine room checks, we can check this data against the sight gauges.
Below is a list of all the physical devices on our NMEA 2000 bus. Much of the Maretron N2KView displays are based on input from these devices. We also have written custom software that reads and writes to the N2KView bus for functionality such as automatic electrical load-shedding.

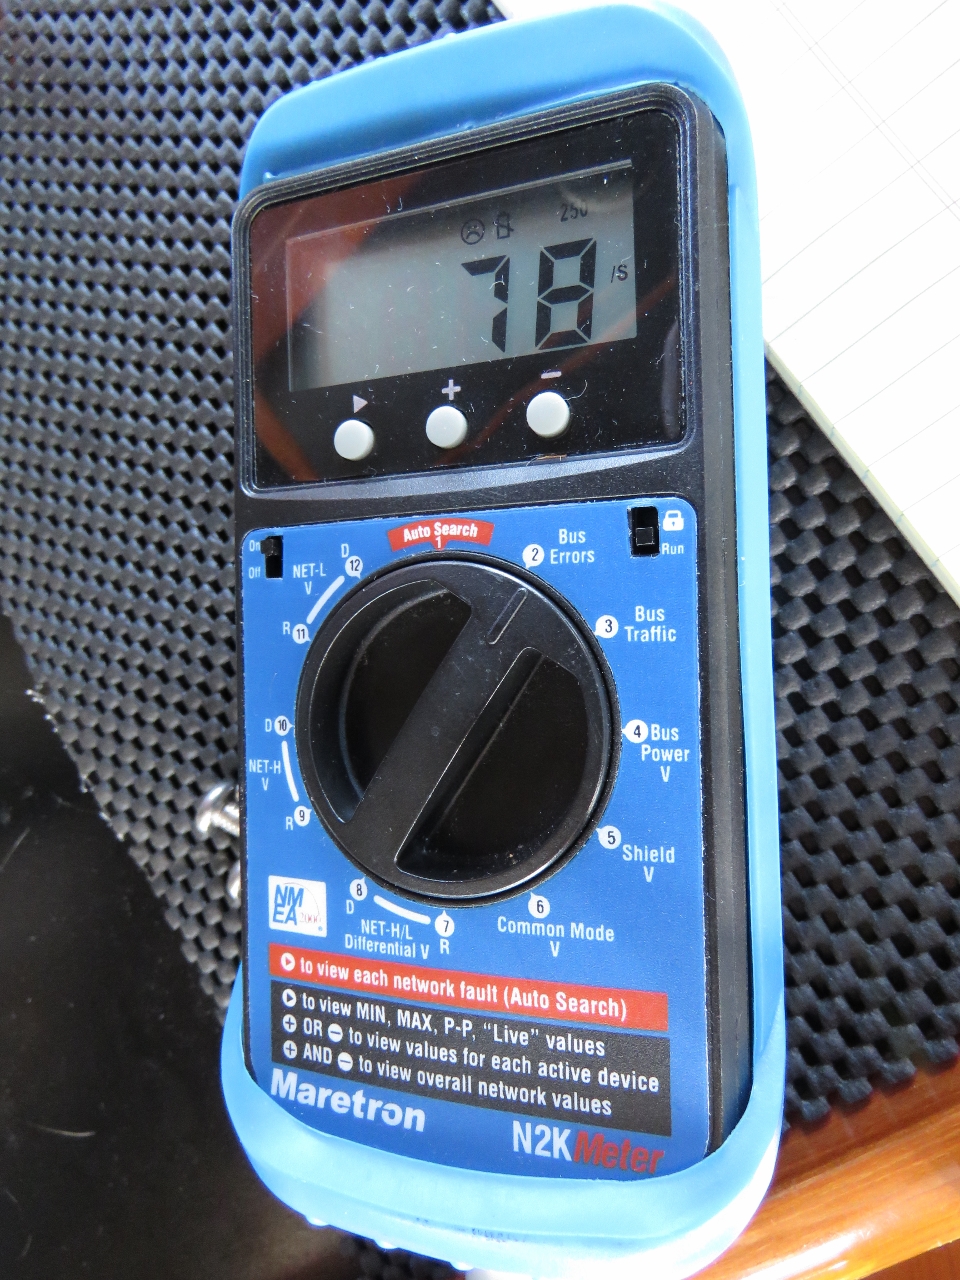
A final tool we use with the Maretron system is their N2kMeter. This does a physical check of the underlying NMEA2000 CANbus physical networking checking power levels, ground quality, and signal integrety. It also tracks and flags network errors. We’ve found it invaluable for tracking down and debugging NMEA 2000 bus issues. It’s rare that a networking problem emerges but, when they do, the meter allows the problems to be quickly isolated and corrected. For larger NMEA2000 networks, we strongly recommend this diagnostic tool.