Electronic diesel engines track usage data to help engine manufacturers and service personal understand causes of different fault conditions and evaluate how well the engine is performing in that specific application. Generally this data isn’t available to end users but, if a service technician is on your boat, it’s worth asking for the engine load profile.
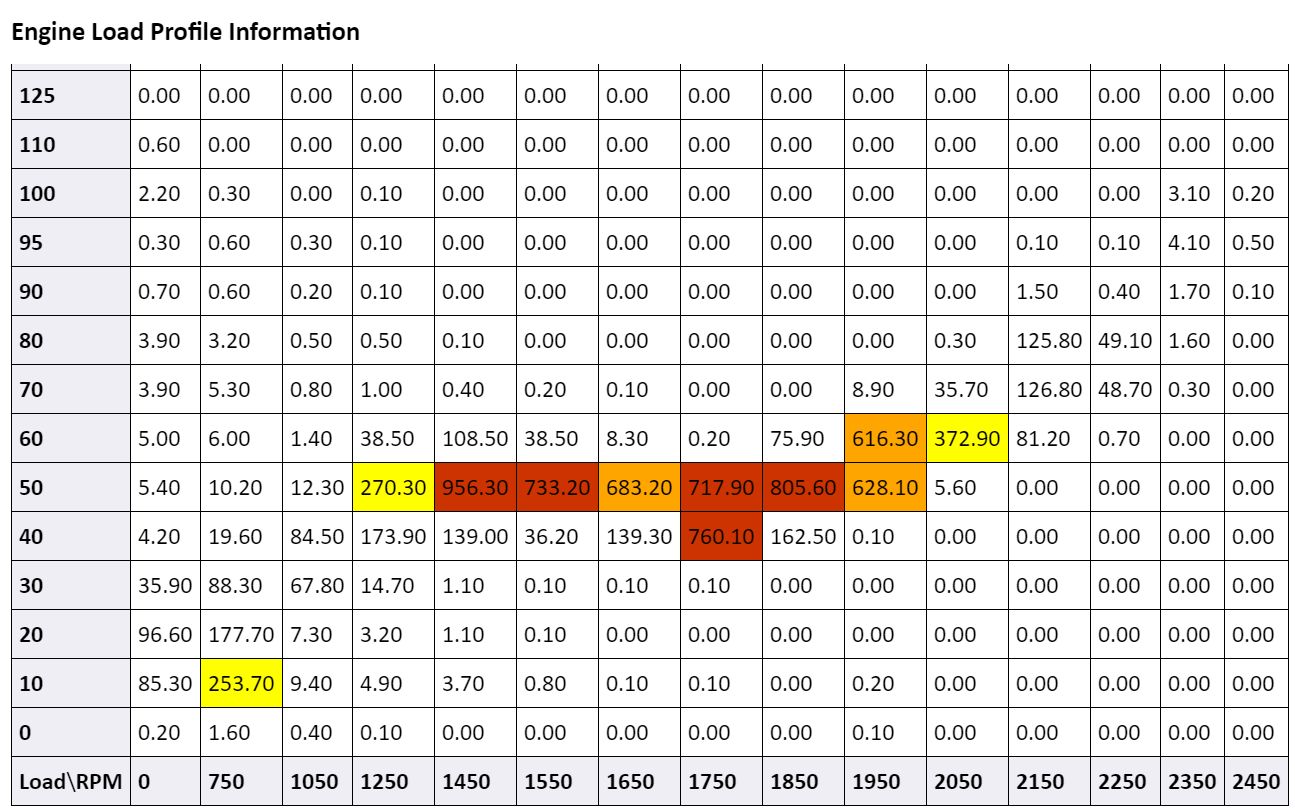
Below is a recent engine load profile for the 6068AFM75 main engine used in Dirona. The Y-axis shows percentage loads at 10% intervals and X-axis shows RPM in 100-RPM increments. Each square on the graph shows the number of hours in that load bucket at that RPM. Squares with the largest hour counts are highlighted with colored backgrounds.
|
When looking at a load profile, expect to see a diagonal line of high hours rising from left to right. Generally, as RPM is raised in gear, the boat will travel at a given speed and this will put a fixed and unchanging load on the engine (assuming you have a fixed pitch prop). Understanding this, why are there multiple load levels at a given RPM? If the bottom is dirty, the load will rise. If the boat is heavier, the load will rise. If there is a strong head wind, the load will rise. Sometimes engine changes like software upgrades or injector changes can subtly change output at a given RPM. But, generally, the hours will concentrate along a rising left-to-right diagonal.
You can also see concentrations of time spent at different RPMs. Dirona runs up around 1,800 to 2,000 RPM (roughly 180hp) when coastal-cruising so there is a concentration in that area. But, for longer ocean crossings, we’ll run far lower output to get the fuel economy we need to make the trip. We normally run in the 1,500 to 1,800 RPM level on longer trips but, rarely, we really push the limits of fuel economy as we did in our 3,700 NM run from St. Helena to Barbados. For these long runs we run down in the 1,200 to 1,500 RPM range.
Another concentration you will usually see on a load profile is time at idle where the boat is waiting for a lock, warming up, cooling down, waiting for a bridge to open, or otherwise unloaded. Usually at idle there will be two concentrations. The first is in gear at low speed moving through a marina and the second is out of gear. Both concentrations are visible at Dirona’s idle of 800 RPM.
Focusing on the lower end of the chart, one anomaly is at 0 RPM which presumably is between 0 RPM and the next bucket start at 750 RPM. Given the idle on Dirona is 800 RPM, there should be nothing in the bucket. However, when our Deere 6068AFM75 was delivered, the idle was 600 RPM. I don’t like low idles and feel running engines slightly faster is better for them, even though it does consume fractionally more fuel. So I asked to move the idle up to 750 RPM.
It’s kind of weird to “ask for” 750 RPM rather than just adjust it myself, but on modern fly-by-wire engines, idle is not adjustable without special software often not available to customers. The only way to change idle is a service visit. The other reason we asked for 750RPM is we have hydraulic loads and the engine has more torque available at 750 RPM than 600, so we made the change. Other than a fractional uptick in fuel consumption at idle, the only disadvantage of a higher idle speed is the load put on the transmission when shifting at idle into gear. We’ll return to engine load at idle and why I later asked to increase the idle speed to 800 RPM.
The first thing I look for in a load profile is to scan across the 100% and above lines and ensure there is no time in overload. You can see that Dirona is fine except for 36 min at 0 RPM with a 110% load. This is actually an interesting anomaly and is why we increased the idle speed to 800. We’ll come back to that issue and, other than that one, there is no time over 100%. This is important and you should especially look hard at higher RPMs where prop curves approach engine max output. Ensure there is nothing over 100% towards the right hand side, higher RPM side of the data.
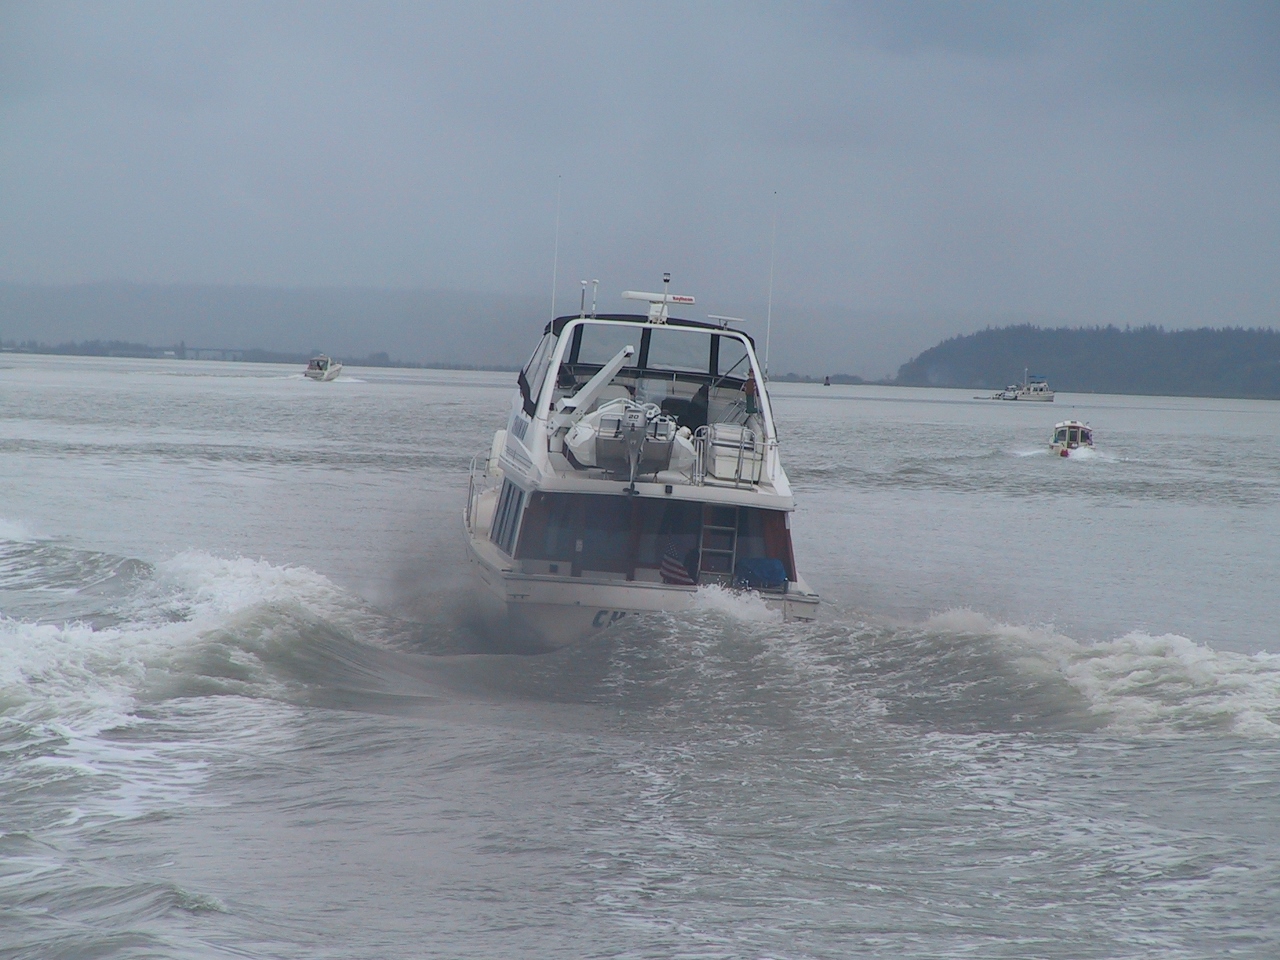
Here’s a picture of a Bayliner 4788 with a serious overload problem. Its Hino engines won’t last long this way.
|
Ensure that the engine in gear at wide open throttle can achieve more than the rated RPM. So, for example, if an engine is rated at 266HP at 2400 RPM, you should ensure that with a full load at wide open throttle you can get up above 2400 RPM. If this is possible, the load profile should show no loads in excess of 100% at rated RPM. This is absolutely vital if you want a long lived diesel engine.
After looking for higher than 100% load, it’s time to look for the expected diagonal load line and look for anomalies. The Dirona load profile has the classic approximate diagonal line rising left to right with two interesting concentration points. One is the time at very low RPMs when doing the really long ocean crossings. The interesting thing about the time at these low output levels is the load levels are actually pretty high—right around 50% of engine capability at that RPM. And the engine oil and coolant temperatures are all sufficiently high even when operating at these low RPMs. This engine actually runs quite well and fairly efficiently at low load levels.
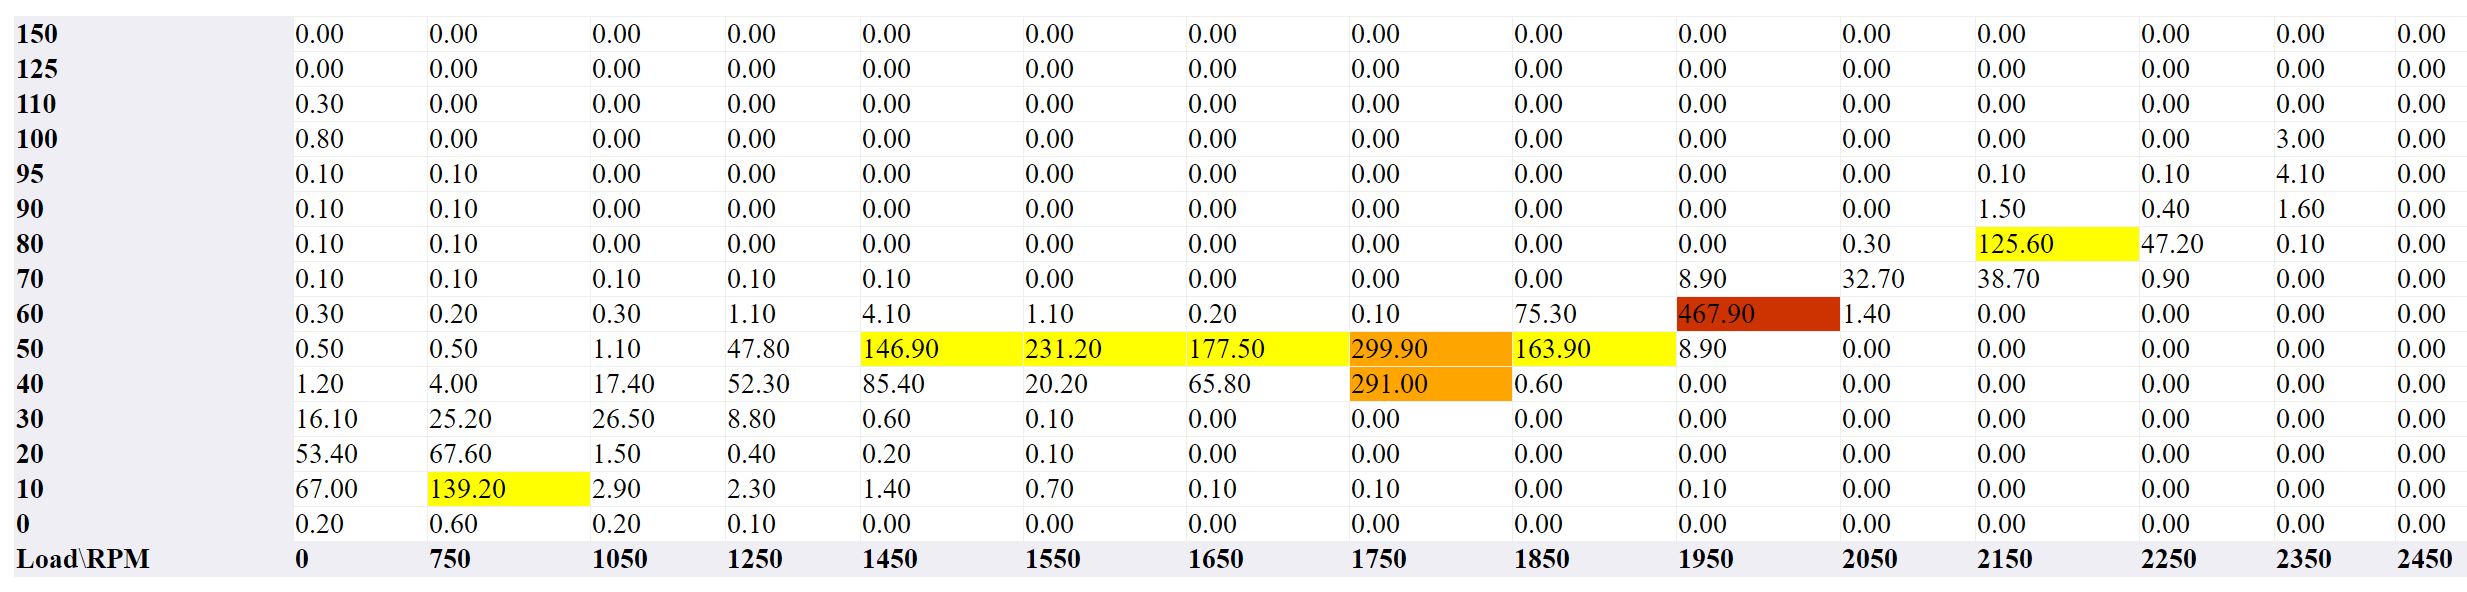
The next anomaly visible in the Dirona load profile data are the high loads at the lowest two RPM levels. What makes this particularly interesting is I have a load profile from back in 2013 that is completely free from these high load at idle data points. Let’s look more closely at the 2013 data (click image for a larger view).
|
If you look at the 2013 data, you’ll see the same diagonal line we expect to see and the same concentrations of time at different load levels. The 2013 load profile is very similar to the 2018 report. The only big difference between the 2013 and the 2018 data is the high load at idle numbers that we need to understand.
Here’s what’s going on at idle. When Dirona was delivered, the engine idle was 600. Because Dirona has hydraulic thrusters, stabilizers, bilge pump and windlass, we lifted the idle to 750 RPM so we could put more hydraulic load on the engine at idle. When using thrusters and the windlass, the main engine is usually at idle and most of the hydraulic load is carried by the wing engine which is a 40 hp Lugger L844D. The wing engine will be running at 2,400 to 2,600 RPM and it will be taking full load during thruster or windlass operation. We’ll be drawing very close to 40hp from the wing and, scanning the 2013 load profile data, you can see the hydraulics and other power-take-off equipment (including dual 4.5kW alternators) are not putting material loads on the main engine. The hydraulic load is almost completely on the wing engine.
Since the main and the wing engines have the same hydraulic pumps, either can deliver the full needed flow and pressure if called upon. If the wing engine ever were to fail (it hasn’t), we could raise the RPM on the main and it would deliver full hydraulic output. But usually when operating the thrusters or windlass, the main engine will be at idle so it’s available for in-gear operation. This has the additional upside of ensuring the wing engine gets ample use and doesn’t rust up and fail through lack of use, as many emergency-only engines do. The wing engine on Dirona gets frequent use and has 860 hours in 8 years.
The secret behind the pre-2013 data that shows little hydraulic load on the main engine at idle is the hydraulic system is set up to draw very little power from the main engine and only as much from the wing as it can deliver at 2,000-2,400 RPM. This is the way that boat was originally configured, because most customers don’t want to run the wing engine under full load and there needs to be capacity left over such that the wing doesn’t stall due to overload during hydraulic operation.
This is a good and stable configuration for the hydraulic system but, what is less good is the hydraulic system is only operating at 80% of its capabilities. Again, operating equipment at less than full rated capacity is often a good decision but hydraulic systems are fine operating at their design pressures. Rated pressures are always far above design pressures, so there is operating safety margin even at full-rated output. In the case of Dirona’s hydraulic system, its design pressure is an unusually high 3,800 PSI but the pipes, hoses, and other components are rated to 4,100 PSI.
What’s not great about operating a hydraulic system at 80% of the design output is the thrusters are also operating at 80% of rated output. This mostly isn’t an issue but when docking in Marsden Cove, New Zealand, we had 25 kts of cross wind with gusts over 30 and the thrusters couldn’t win. It wasn’t a problem, but I couldn’t help thinking that worse conditions in close quarters could become a problem quickly. I really wanted the thrusters operating at their full-rated output.
The change I made was to boost the hydraulic operating pressure from the de-rated 3,100-3,200 PSI the boat was delivered with to the full 3,800 PSI the hydraulics system is capable of. To do this, I upped the standard operating procedure for the wing when docking to run at 2,400-2,600 RPM so we can take the full 40 hps from it. But, since we have two 18 HP thrusters and there are inefficiencies in a hydraulic systems, the 40 HP wing doesn’t have the power to fully run both thrusters at full output. We don’t want to overload the wing engine, and even more importantly, we must not let it stall during a close-quarters docking situation. So I moved some hydraulic load onto the main engine. This is easy to do but there are two constraints on the amount of power that can be transferred: 1) the transmission PTO that drives the hydraulic pump has a maximum torque rating that must not be exceeded, and 2) we need to avoid overloading the main engine.
You wouldn’t expect a 266HP engine to ever be close to overload when driving hydraulics and engine accessories, but the maximum load rating for most modern engines below 1,000 RPM is quite small. Looking at the newest load profile, you can see the impact of this additional hydraulic load. The main engine loads at idle now range from 10% to 110% depending upon hydraulic operating loads. You can see I got it fairly close to where we want it, but there are 36 minutes over 100%. Technically you really want this time at over 100% to be zero, but overload at idle isn’t as much of a concern as overload at full rated power output and 36 min in 9,560 hours is fairly small. More importantly, these 36 minutes are not consecutive minutes but the sum of a lot of tiny excursions seen over 9,560 hours.
We now have an explanation for the high loads at idle visible in the 2018 load profile and, since these hydraulic changes were made later in the year than the 2013 load profile, we understand why we didn’t see them back then. Load profiles can really be informative.
We’re also really happy with our hydraulic configuration. We can fully drive the windlass or both thrusters at the same time with everything operating at full rated pressure without the wing engine ever being even close to overload or, worse, stalling. In fact, the wing will never stall. As wing RPM is lowered, the hydraulic output slowly goes down, but this hydraulic configuration never pushes the wing into overload under any conditions. We are asking for a lot from the main engine but the load profiles show we’re not over loading it.
If you can get a load profile, it’s worth asking for it. And, for sure, ensure you can always exceed rated RPM at full throttle in gear. If you can’t, make changes. Overload is a leading way to shorten the life of a diesel marine engine.
James, great article on the hydraulic configuration. Very informative to my future boat planning. Something I’ve been trying to get a better picture of is sharing hydraulic loads between main and wing, specifically do both pumps provide capacity to a common set of loads, or must the loads be split? I can’t quite tell from your description which is the case on Dirona but it sounds like the loads have to be split.
Thanks!
No, both pumps drive all loads. It’s a really nice design where either pump can drive all loads. If the main is idling and the wing isn’t running (we don’t run this way), the thruster (or windlass) speed and strength will be low but it’ll still work. If the wing is running at full output and the main isn’t running (we don’t runs this way), we’ll have almost full thruster and windlass power. With the main idling and the wing at full output (this is our normal operating mode), all hydraulic devices are available and can be used at the same time with full output.
When underway on the wing and the main off, the stabilizers are full operational and at full output. Same with the wing off and the main running even at low revs. The reason this works is the stabilizers don’t require much oil volume and run at less than 1/2 the pressure of the rest of the equipment. Little power is consumed by the stabilizers.
Overall, it’s a nice and easy to use system and has been working well for years.
Wow, great system design! I was really hopeful that it would be possible to have redundant/enhanced hydraulic capacity in this way. Once again, Dirona sets the gold standard for technical excellence!
Hydraulic systems are both flexible and reliable. We’re glad we went hydraulic on Dirona.
I had to read that three times. But I got it! Thanks so much for sharing.